

traceOn
2 ratings
)
Overview
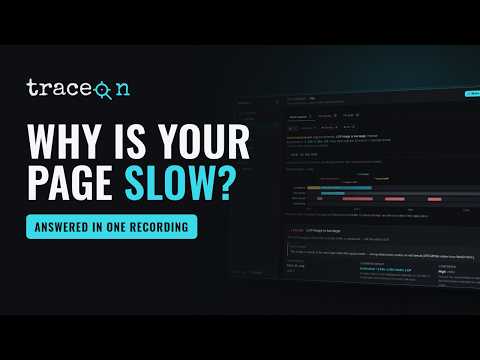
Turns raw browser performance traces into a plain-language diagnosis of what's slow, why, and what to fix first.
traceOn traceOn turns a raw browser performance trace into a plain-language diagnosis of what's slow on a web page, why it's slow, and what to fix first. Most performance tools hand you a flame chart and leave the interpretation to you. traceOn does the interpretation. Click Record, capture a DevTools Protocol trace of the tab you choose, and traceOn analyzes it entirely on your own machine to produce a readable, actionable report. What You Get From One Recording Verdict & Performance Score Get an immediate explanation of what's making the page slow, alongside a performance score. traceOn analyzes and explains: LCP — Largest Contentful Paint INP — Interaction to Next Paint CLS — Cumulative Layout Shift FCP — First Contentful Paint TTFB — Time to First Byte Total Blocking Time Instead of just showing numbers, traceOn explains what caused them and what contributed to the score. Root Causes With Evidence Every finding is backed by evidence from the trace. Each issue identifies: The responsible file, task, request, or element Estimated performance impact Confidence level Where it occurred on the timeline Supporting trace evidence So instead of "your page is slow," you get an explanation of what happened, where it happened, and why it matters. A Fix Plan Don't stop at identifying problems. traceOn turns findings into an ordered list of recommended fixes — helping you understand what to change first, what to change next, and why. The recommendations are written so you can: Fix them yourself Copy them into an issue Send them directly to the developer responsible for the site Load Timeline See how the page came together from beginning to end. Instead of a wall of trace spans, traceOn presents the loading process as a readable timeline showing the important events and their relationships. Activity Inspect the page's activity on a single timeline. See: Network requests Long main-thread tasks Console output Drag across the timeline to focus on a specific moment and understand what was happening when performance degraded. Security Checks Get a quick security overview alongside your performance analysis. traceOn checks: Content Security Policy (CSP) HSTS X-Frame-Options Other important response headers HTTPS configuration Cookie security flags Mobile or Desktop Record the page under different conditions. Analyze a page as: 📱 Mobile 🖥️ Desktop This makes it easier to identify problems that only appear under mobile-like loading conditions. Across Runs History & Compare Every recording is kept so you can see how a page changes over time. Pin a run as a baseline, make your changes, and record again. traceOn helps you determine whether the change actually improved performance while accounting for normal run-to-run measurement noise. Interaction Watch Don't just test page load performance. Turn on Interaction Watch, use a site normally, and traceOn monitors your interactions. It catches: Clicks Keypresses Other user interactions When an interaction takes 200ms or more, traceOn records the interaction and identifies the script responsible. Interaction Watch automatically stops after 30 minutes. Test Lab What-If Wondering how much a third-party script or domain actually costs? Block a script or domain and measure the difference. traceOn repeatedly loads the page with the cache disabled and compares the results so you can see the measured cost of what you removed. Use it to answer questions like: "How much faster would this page be without this third-party script?" Compare Sites Load your page alongside up to three other sites and compare their performance. See where the differences come from and investigate why another implementation may be loading or responding differently. Responsive Check Find responsive layout problems across device sizes. traceOn checks for: Horizontal overflow Overlapping elements Tiny tap targets Other responsive layout issues Includes a live preview so you can see the problem rather than relying only on a report. DevTools Panel Need a quick performance check without running a full recording? Open the traceOn DevTools panel for a lightweight Web Vitals readout. Use it when you want a fast signal before running a deeper trace. Privacy First Everything happens on your device. traceOn does not require an account, and recordings are not uploaded to a server. 🔒 No account required 🖥️ Analysis happens locally 🚫 No ads 🚫 No trackers 🚫 No data sales 🔐 Your recordings stay on your device Read the full privacy policy: Everything happens on your device. traceOn needs no account, and nothing you record is sent to any server. No ads, no trackers, no data sales. Full policy: https://traceon-community.solomon-muhye-wd.workers.dev/privacy Who It's For traceOn is built for anyone who needs to understand why a web page feels slow. Web Developers Find the code, request, task, or rendering problem responsible for poor performance without manually digging through thousands of trace events. Performance Engineers Go from raw trace data to evidence-backed findings and repeatable comparisons. Teams Turn performance investigations into concrete, prioritized fixes that can be shared with the people responsible for the site. The Idea Behind traceOn DevTools shows you what happened. traceOn helps explain why it happened and what to do about it. Instead of leaving you with a flame chart and hundreds of thousands of trace events, traceOn turns browser performance data into a diagnosis you can actually act on.
5 out of 52 ratings
Details
- Version0.4.0
- UpdatedOctober 3, 2026
- Size443KiB
- LanguagesEnglish (United States)
- Developer
Email
solomonmuhye12@gmail.com - Non-traderThis developer has not identified itself as a trader. For consumers in the European Union, please note that consumer rights do not apply to contracts between you and this developer.
Privacy

traceOn has disclosed the following information regarding the collection and usage of your data. More detailed information can be found in the developer's privacy policy.
traceOn handles the following:
This developer declares that your data is
- Not being sold to third parties, outside of the approved use cases
- Not being used or transferred for purposes that are unrelated to the item's core functionality
- Not being used or transferred to determine creditworthiness or for lending purposes