

StockStats
ExtensionEducation3 users
Overview
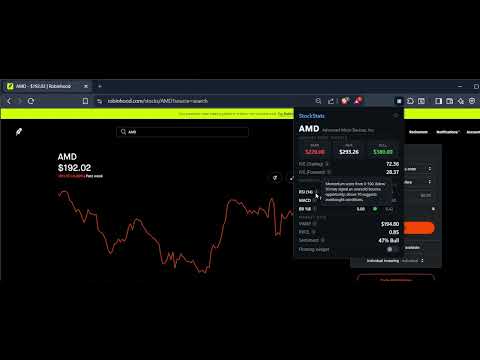
At-a-glance stock summary when browsing Robinhood.
StockStats gives you an instant at-a-glance summary of any stock you're viewing on Robinhood. Click the extension to see key technical indicators (RSI, MACD, Bollinger Bands), analyst price targets, P/E ratios, VWAP, relative volume, and community sentiment — all in one compact popup. Data is pulled in real time from multiple financial APIs, so you always get a current picture without leaving the page. Requires free API keys from FinancialModelingPrep, Alpha Vantage, and Finnhub to get started. Not financial advice — for informational purposes only.
0 out of 5No ratings
Details
- Version0.4.0
- UpdatedMarch 9, 2026
- Size24.68KiB
- LanguagesEnglish
- Developer
Email
justsomesolodev@gmail.com - Non-traderThis developer has not identified itself as a trader. For consumers in the European Union, please note that consumer rights do not apply to contracts between you and this developer.
Privacy

Manage extensions and learn how they're being used in your organization
The developer has disclosed that it will not collect or use your data.
This developer declares that your data is
- Not being sold to third parties, outside of the approved use cases
- Not being used or transferred for purposes that are unrelated to the item's core functionality
- Not being used or transferred to determine creditworthiness or for lending purposes