


Overview
Easy way to check the Debug logs
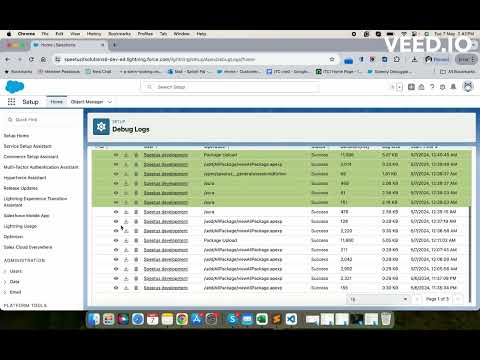
Salesforce Debugger Chrome Extension Salesforce Debugger Chrome Extension is designed to streamline the debugging process for salesforce developers.This extension offers a comprehensive suite of features aimed at simplifying the management of Trace Flags and Debug Logs within the Salesforce environment. Whether you're troubleshooting code errors, monitoring system behavior, or optimizing performance, this tool provides efficient solutions tailored to your debugging needs. With intuitive functionalities and seamless integration into your Salesforce workflow, this extension empowers developers to efficiently trace, analyze, and resolve issues, ultimately enhancing productivity and accelerating development cycles. From managing Trace Flags to searching and filtering Debug Logs, this extension equips developers with the tools needed to effectively debug and optimize their Salesforce applications. In this document, we'll provide a concise overview of the extension's key features, outlining how each functionality enhances the debugging process for Salesforce developers. Whether you're new to debugging in Salesforce or seeking to streamline your current workflow, this extension offers a user-friendly interface and robust capabilities to support your debugging endeavors. Trace Flag : Functionalities 1. Add Current User (Button): ● If the trace flag for the current user (logged-in user) is not active, prompts to create a new trace flag. ● If the trace flag for the current user is active, displays active records and allows creating a new trace flag by selecting debug level. It replaces the existing trace flag upon saving. 2. New (Button): ● Creates a trace flag for a user based on TraceEntityName, StartDate, Expiration Hours, and DebugLevel. ● Handles creation for active users, prompts for error on past date selection, and disables save button until debug log is selected. ● Toast notification on successful creation. 3. Refresh (Button): ● Refreshes all trace flags. 4. Delete (Button): ● Deletes the selected record and notifies the user on the scrolled page. ● Shows error toast if the record is deleted from the org while editing, deleting, or renewing on the extension side. 5. Renew (Button): ● Renews trace flags for the next 24 hours. ● Shows error if the trace flag exists for the same traced entity, prompting the user to replace it upon saving. Debug Log : Functionalities 1. User Search Functionality: ● Enables users to search debug logs of active trace flag users. ● Filters debug logs using various options, allowing addition and removal of user names. 2. Search String Functionality: ● Facilitates searching strings within the debug log body. ● Highlights rows containing the searched string, with automatic de-highlighting upon change. ● Highlights only the first page of pagination on search. 3. Action Tabs: ● Provides options to get all logs of the logged-in user, refresh all logs, and delete all logs. 4. View (Button): ● The "View" button offers a comprehensive insight into various aspects of the debugging process, presenting a series of sub-tabs each with distinct functionalities. Within these tabs: ➢ Log Details: Users can access creation dates, log lengths, and associated user information. ➢ Debug Log: This tab displays the debug log body, color-coded to represent different labels for enhanced readability. ➢ Queries: Developers can review all SOQL queries present in the debug log, including details such as the line number in the Apex class or trigger where the query is written, the number of records retrieved, and the option to navigate directly to the query line within the debug log. ➢ User Debug: Custom debug data, such as that generated by system.debug statements, is consolidated in this tab. Users can identify the line number where the debug statement is written, view the printed data, and navigate to the specific debug line within the debug log. ➢ Order of Execution: This tab provides insights into debug log limits usage, detailing various limitations such as API call usage or heap size. Users can monitor their usage compared to set limits, with color-coded alerts indicating when usage exceeds 80% (yellow) or reaches 100% (red). ➢ Org Limits: Users can access organization-wide limits across different categories presented in a tabular format, facilitating a comprehensive overview of the current usage and thresholds within the Salesforce environment. ➢ Download: Users can download debug logs in Excel format with subtabs available on the page. 5. Download (Button): ● Users can download debug logs as well in Excel format. 6. Delete (Button): ● Deletes the selected record and notifies the user on the scrolled page. Note: To perform all the activity mentioned above, tool will be used to access the active session id from browser for respective salesforce org.
4.6 out of 514 ratings
Details
- Version1.5.1
- UpdatedFebruary 21, 2025
- Size1.17MiB
- LanguagesEnglish (United States)
- DeveloperSpeetus IT solution Private LimitedWebsite
1ST FLOOR 96A VIDHYA PALACE COLONY Indore, Madhya Pradesh 452005 INEmail
ajay@speetus.com - Non-traderThis developer has not identified itself as a trader. For consumers in the European Union, please note that consumer rights do not apply to contracts between you and this developer.
Privacy

This developer declares that your data is
- Not being sold to third parties, outside of the approved use cases
- Not being used or transferred for purposes that are unrelated to the item's core functionality
- Not being used or transferred to determine creditworthiness or for lending purposes
Support
For help with questions, suggestions, or problems, visit the developer's support site