

Salesforce Dev Studio – Apex, LWC, SOQL & Debug Log IDE
3 ratings
)
Overview
VS Code-style IDE for Salesforce: edit & deploy Apex/LWC, SOQL autocomplete, debug log analyzer, replay debugger & data import.
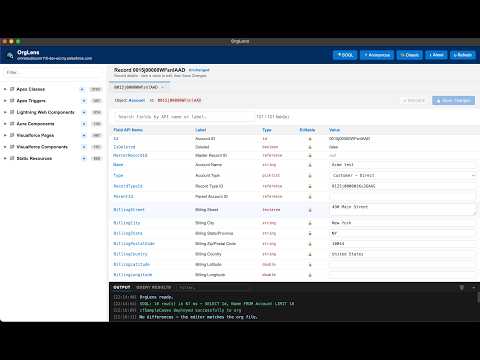
Salesforce Dev Studio (Apex,LWC,SOQL,Debug and Import) — a VS Code–style IDE for Salesforce, right in your browser. A fast alternative to the Developer Console. Open it from any Salesforce tab for a full code workspace against your org via the Tooling API — no CLI, no setup. Or use the on-page tabs to jump straight into a record, a SOQL query, or Setup. Code editor Browse, open, edit, diff and deploy Apex classes, Apex triggers, LWC, Aura and Visualforce. Syntax highlighting; code folding for Apex, JS, JSON, XML and HTML with real VS Code–style line numbers; find & replace; formatting; multi-tab editing; per-file download; unsaved-change tracking; a full-screen focus mode; and session restore. SOQL editor Autocomplete for objects, fields and relationships (matches anywhere in the name, with a distinct icon per field type), plus value suggestions — picklist values and true/false — shown as chips at the bottom of the editor. Results render as a table with expandable rows and clickable record Ids. Auto-comma on field pick, a Tooling toggle, query history, and export of all open queries. Each SOQL tab runs independently — execute several queries in parallel, and Stop any running query. Records — "Show All Data" Enter a record Id (or click one anywhere an Id appears) to load every field, edit with type-aware controls, save back to Salesforce, and refresh. Search fields by API name, label or value. Any Salesforce Id is clickable to copy, open in Salesforce, or show all its data. Debugging Execute Anonymous Apex; retrieve and colour debug logs (download or delete). An Apex Replay Debugger steps through Apex, triggers and anonymous code line by line — variables, call stack, console, resizable panels, jump-to class/method, and SOQL row counts. Run Apex tests with class-file-level code coverage. Manage debug TraceFlags: view active traces, delete them, or add one for any user with a chosen level. More tools Network logs inspector for aura.ApexAction (@AuraEnabled) calls with copyable request/response; a JSON tools tab (format, minify, unescape, collapsible tree with line numbers, find); global find-in-tab with match count and next/previous everywhere; copy Session Id; the logged-in user shown by the org URL; light and dark themes; and drag-reorderable toolbar buttons and on-page tabs. Built for Salesforce developers, admins and consultants who want a quick code editor, query tool and debugger without leaving the browser.
5 out of 53 ratings
Details
- Version1.73.0
- UpdatedOctober 15, 2026
- Offered byParesh
- Size533KiB
- LanguagesEnglish
- Developer
Email
koshtiparesh01@gmail.com - Non-traderThis developer has not identified itself as a trader. For consumers in the European Union, please note that consumer rights do not apply to contracts between you and this developer.
Privacy

This developer declares that your data is
- Not being sold to third parties, outside of the approved use cases
- Not being used or transferred for purposes that are unrelated to the item's core functionality
- Not being used or transferred to determine creditworthiness or for lending purposes