


Overview
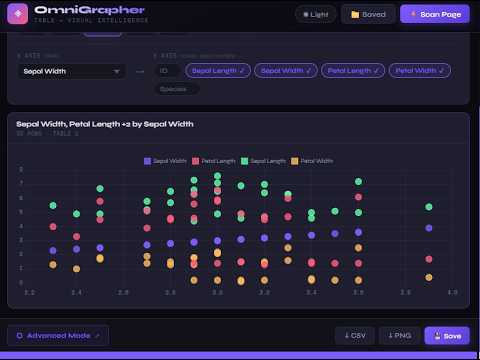
Extract data from any webpage table and visualize it as interactive charts with X/Y axis control.
🚀 **OmniGrapher: Table → Visual Intelligence** 📈 OmniGrapher is a powerful browser extension designed to turn static webpage tables into dynamic, actionable insights instantly. Instead of manually copying and pasting data into spreadsheets, OmniGrapher does the heavy lifting for you instantly. ✨ **Core Capabilities** 🔍 **Instant Page Scanning** - One-click scanning ⚡ to detect all tables on any active webpage. - Intelligent table identification with row/column counting. - Simple **Table Picker** to switch between multiple datasets on a single page. 📊 **Dynamic Visualization** - **Interactive Charts:** Powered by Chart.js for professional, high-quality renders. - **Customizable Axis Control:** - 🔀 **X-Axis:** Select the primary dimension for your data. - 📈 **Y-Axis:** Toggle multiple data series via "chips" to compare different metrics on one chart. - **Multiple Chart Types:** Quickly switch between bar, line, scatter, radar, and pie charts to find the best perspective for your data. 🎨 **Premium Experience** - 🌓 **Adaptive Themes:** A sleek, modern interface with full support for **Dark** and **Light** modes. - 💎 **Sophisticated UI:** Features a high-end design using 'Syne' and 'Space Mono' typography for a technical, polished look. - ⚡ **Fast Performance:** Minimal overhead with a responsive popup interface (800px width). 💾 **Data & Export Tools** - 📁 **Persistence:** Save your favorite dashboards locally to revisit them later. - 📥 **Export Options:** - **CSV:** Export the extracted table data for further analysis. - **PNG:** Save your visualized chart as an image for reports or presentations. - 🌐 **Advanced Mode:** Seamless integration with a web-based advanced toolkit for deeper analysis. 🛠️ **Technical Stack** - **Manifest V3** architecture for security and performance. - **Chart.js** for robust data rendering. - **Content Scripting** for precise DOM table extraction. **Transform the web into your own data dashboard!** 🚀📊 🛠️ **Web APP Future Work** - We are aware there there might be issues (in the extension) worth ironing out such as the radar map that in some tables misses one of the columns. - The web app features more advanced tools such as log scaled graphs, automatic numeric data detection, symbol filtering, date parsing...etc - Also keep in mind that only HTML tables are parsed thus excluding images of tables and pdfs
5 out of 51 rating
Details
- Version2.0.0
- UpdatedApril 24, 2026
- Size86.4KiB
- LanguagesEnglish
- DeveloperWebsite
Email
info@bitopsy.com - Non-traderThis developer has not identified itself as a trader. For consumers in the European Union, please note that consumer rights do not apply to contracts between you and this developer.
Privacy

This developer declares that your data is
- Not being sold to third parties, outside of the approved use cases
- Not being used or transferred for purposes that are unrelated to the item's core functionality
- Not being used or transferred to determine creditworthiness or for lending purposes
Support
For help with questions, suggestions, or problems, visit the developer's support site