Item logo image for ObservePoint Debugger
ObservePoint Debugger

www.observepoint.com/tag-debugger
4.1(

53 ratings

)
Item media 6 screenshot
Item video thumbnail
Item media 2 screenshot
Item media 3 screenshot
Item media 4 screenshot
Item media 5 screenshot
Item media 6 screenshot
Item video thumbnail
Item media 2 screenshot
Item media 3 screenshot
Item media 4 screenshot
Item media 5 screenshot
Item media 6 screenshot

Overview

Troubleshoot analytics tags, variables, events, cookies, and more. Supports Adobe Analytics, Google Analytics, and thousands more.

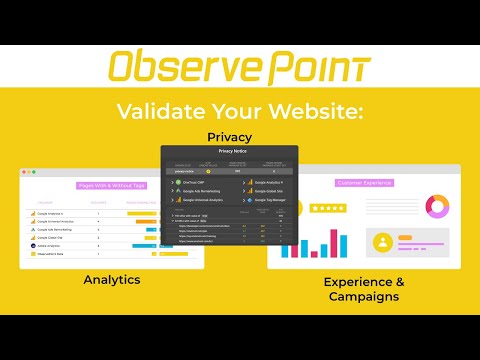
ObservePoint’s Debugger is a free Chrome Extension for troubleshooting analytics and marketing tags on your live website. Debugger captures page-load and event-triggered requests for marketing and analytics tags and parses them into a human-readable format for easy tag or cookie debugging. ObservePoint's Debugger is the first step towards comprehensive and efficient governance of your analytics, marketing tags, and cookies. ObservePoint’s full platform of web governance solutions can help you: 🔅 Scan batches of pages or sequences of actions to verify accurate data collection 🔅 Monitor your live implementation for errors in analytics tracking and variable formatting 🔅 Test analytics in development and staging environments before releasing to production 🔅 Simulate important customer journeys to test for obstacles in conversion paths 🔅 Identify and locate cookies set by tags 🔅 Receive notifications whenever your implementation fails expectations Get a free trial to see how ObservePoint can help you automate and scale analytics testing, privacy monitoring, and experience validation on your entire website: https://www.observepoint.com/free-trial/ :: More Details About The ObservePoint Debugger :: Debugger is designed to help you debug analytics and marketing tags on a page-by-page basis. After installing the Debugger extension, you will see a new tab in your Chrome Developer Tools. Simply open this tab, refresh the page, and see which marketing and analytics tags and cookies are firing on your website. For each tag, you will see the following information: 🔅 Tag Name (e.g. Google Analytics 4, Adobe Analytics, Ensighten, OneTrust CMP Banner) 🔅 Account (e.g. op-prod, G-299302931) 🔅 Category (e.g. Analytics, Advertising, Social, Tag Management) 🔅 Status (standard HTTP response codes) 🔅 Request size/Response size 🔅 Total Time/Latency 🔅 Cookies Set by the "set-cookies" Header :: Basic Debugging :: Clicking into each tag allows you to see the network request formatted as an easy-to-read list of variables and cookies set by the tag. You can also view the actual request in both its HTML-encoded and decoded formats. To clear the log, simply click the “Clear Collected Data” button at the top right of the extension’s interface. :: Debugging On-Click Events and Cross-Domain Tracking :: By default, Debugger retains the log of requests when navigating to a new page. By toggling the "Preserve log" option in the extension’s interface, users can make the log clear when moving from page to page. This may hinder troubleshooting on-click events and cross-domain tracking. :: Downloading Data :: Users can download an Excel file of each tag by clicking on the “Export data” button at the top right of the interface. This data will appear in your Downloads folder as a file named OP_Debugger_Results_[CURRENT-DATE].xslx. :: Get Started :: Debugger is an excellent alternative for anyone who may currently use one or more of the following solutions: WASP, Charles, Fiddler, OmniBug, Adobe Debugger, or Tag Inspector. To use this extension, follow these five easy steps: 1. Ensure the extension is enabled by selecting More Tools from the Google Chromes’ ellipses menu, then selecting Extensions, and verifying the ObservePoint Debugger is enabled. 2. Open the Chrome Developer Tools: --On Windows and Linux, press Control-Shift-I or F12. --On Mac, press Command-Option-I. 3. Select the ObservePoint panel. 4. Refresh the page you are on. 5. Click on a tag to start debugging. By installing this extension, you agree to the ObservePoint Terms of Service at http://www.observepoint.com/privacy-policy For more information on the Debugger tool, visit: https://help.observepoint.com/en/articles/9113174-observepoint-tag-debugger-chrome-extension

4.1 out of 553 ratings

Google doesn't verify reviews. Learn more about results and reviews.

Review's profile picture

Patricia SebastianJun 18, 2024

works perfect!!

2 out of 2 found this helpful
Review's profile picture

Chris CochranFeb 20, 2023

This extension used to have utility, but now it opens a new tab claiming it is "updated" in every browser, every time I open a browser. Over and over and over. It's beyond annoying, and I am removing this extension from all browsers immediately. I used to use it and actually recommended it to some colleagues, but NEVER again. Buggy, annoying, and annoying. Also, it's SUPER ANNOYING to get these tabs opening up repeatedly, which is really annoying. Now, you should be as annoyed as I am using ... Show more

1 person found this review to be helpful
Replier's profile picture

Chrome DevelopmentDeveloperJan 24, 2024

Hey Chris, sorry about this. We had a bug that caused the annoying pop-ups. These are resolved and we have tests in place to prevent this type of thing from happening again. Hope you'll give us another try.

Review's profile picture

Olivier VIT et équipe RESONEOFeb 17, 2023

Hey Pretty reliable in detecting and parsing tag that effectively did fire But since a few days it keeps opening a new tab towards https://www.observepoint.com/ claiming that it has updated. Once would be OK, but now it's daily !!! Please let us work !

3 out of 3 found this helpful
Replier's profile picture

Chrome DevelopmentDeveloperJan 24, 2024

Hey Olivier, sorry about this. We had a bug that caused the annoying pop-ups. These are resolved and we have tests in place to prevent this type of thing from happening again. Hope you'll give us another try.

Details

  • Version
    2.24.196
  • Updated
    August 21, 2024
  • Size
    3.6MiB
  • Languages
    English (United States)
  • Developer
    ObservePoint
    2100 Pleasant Grove Blvd #300 Pleasant Grove, UT 84062 United States
    Website
    Email
    support@observepoint.com
  • Non-trader
    This developer has not identified itself as a trader. For consumers in the European Union, please note that consumer rights do not apply to contracts between you and this developer.

Privacy

The developer has disclosed that it will not collect or use your data. To learn more, see the developer’s privacy policy.

This developer declares that your data is

  • Not being sold to third parties, outside of the approved use cases
  • Not being used or transferred for purposes that are unrelated to the item's core functionality
  • Not being used or transferred to determine creditworthiness or for lending purposes

Support

Related

Adswerve - dataLayer Inspector+

4.5(44)

DataLayer Tools for Digital Analysts

Activity Map

2.6(31)

View key site metrics in an intuitive visual format.

Ensighten Developer Tools

3.6(14)

Ensighten Utilities

Adobe Experience Cloud Bookmarks

4.8(13)

Bookmarks to Adobe Experience Cloud: Analytics, AEP Data Collection Tags (formerly Launch), Target, Campaign, AEM and other products

Omnibug

4.1(50)

Omnibug is a browser extension to decode and display outgoing digital marketing tool requests.

Google Analytics Debugger

4.2(534)

Prints useful information to the JavaScript console by enabling the debug version of the Google Analytics Javascript.

WASP.inspector: Analytics Solution Profiler

4.5(189)

Digital analytics quality made easy

Launch and DTM Switch

3.1(192)

Enables the developer to locally override the embedded Launch or DTM library for testing.

Analytics Debugger

4.6(203)

Your Single Source of Truth (SSOT) for debugging analytics implementations

dataslayer

4.6(80)

Debug and test tag management (Google Tag Manager, DTM, Tealium) and analytics implementations.

Tealium Tools

4.4(29)

Enhance your Tealium implementations by evaluating your website data and tags through a variety of helpful tools.

Debugger for Adobe Analytics

4.4(56)

Prints to JavaScript console what data is sent to Adobe Analytics.

Adswerve - dataLayer Inspector+

4.5(44)

DataLayer Tools for Digital Analysts

Activity Map

2.6(31)

View key site metrics in an intuitive visual format.

Ensighten Developer Tools

3.6(14)

Ensighten Utilities

Adobe Experience Cloud Bookmarks

4.8(13)

Bookmarks to Adobe Experience Cloud: Analytics, AEP Data Collection Tags (formerly Launch), Target, Campaign, AEM and other products

Omnibug

4.1(50)

Omnibug is a browser extension to decode and display outgoing digital marketing tool requests.

Google Analytics Debugger

4.2(534)

Prints useful information to the JavaScript console by enabling the debug version of the Google Analytics Javascript.

WASP.inspector: Analytics Solution Profiler

4.5(189)

Digital analytics quality made easy

Launch and DTM Switch

3.1(192)

Enables the developer to locally override the embedded Launch or DTM library for testing.