


Overview
Measure page load performance
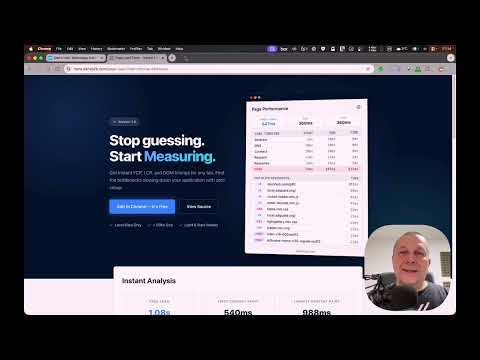
Instant page load performance at a glance - no DevTools required. Page Load Timer shows real performance data for any website you visit. Click the icon and see exactly how the page loaded: total time, Core Web Vitals, phase-by-phase timeline, and the slowest resources dragging it down. 👉 WHAT YOU GET Page Load / FCP / LCP - the three numbers that matter most, front and center. Load Timeline - see where time is spent: Redirect, DNS, Connect, Request, Response, DOM processing. The slowest phase is highlighted so you spot the bottleneck immediately. Top Slow Resources - the 10 slowest assets on the page, sorted by load time. Each one is tagged by type (JS, CSS, IMG, XHR, FONT) so you know what to optimize first. Resources over 500 ms are flagged in red. Badge on Icon - the extension icon shows the load time in seconds, color-coded: green (under 1s), orange (under 3s), red (over 3s). You can see page speed without even opening the popup. 👉 WHO IT'S FOR - Web developers checking performance without opening DevTools - QA engineers verifying page speed during testing - SEO specialists auditing Core Web Vitals across pages - Anyone curious about how fast (or slow) websites really are 👉 CUSTOMIZABLE - Theme: Auto (follows your OS), Light, or Dark - Density: Roomy, Default, or Compact - fits your preference - Toggle sections on/off: hide the timeline or resources table - Badge on/off: disable the icon badge if you prefer a clean toolbar - All settings are saved and persist across sessions 👉 LIGHTWEIGHT AND PRIVATE - Under 20 KB total. No frameworks, no dependencies, no build step. - Manifest V3. Runs as a service worker - no persistent background page. - All data stays local in your browser. Nothing is sent anywhere, ever. - No analytics, no tracking, no external requests. - Minimal permissions: only activeTab, storage, scripting, and tabs. - Open source: https://github.com/denisrasulev/page-load 👉 HOW IT WORKS When a page loads, the extension captures navigation timing and Web Vitals (FCP and LCP via PerformanceObserver). It groups and ranks resources by load time. Open the popup to see everything. For tabs that were already open, it collects data on demand - just click the icon.
0 out of 5No ratings
Details
- Version1.0.1
- UpdatedFebruary 27, 2026
- Offered byDen's Hub
- Size249KiB
- LanguagesEnglish
- DeveloperDenis Rasulev
Lenardova 12 Bratislava 851 01 SKEmail
support@denshub.comPhone
+421 919 285 312 - TraderThis developer has identified itself as a trader per the definition from the European Union and committed to only offer products or services that comply with EU laws.
Privacy

This developer declares that your data is
- Not being sold to third parties, outside of the approved use cases
- Not being used or transferred for purposes that are unrelated to the item's core functionality
- Not being used or transferred to determine creditworthiness or for lending purposes
Support
For help with questions, suggestions, or problems, please open this page on your desktop browser