


Overview
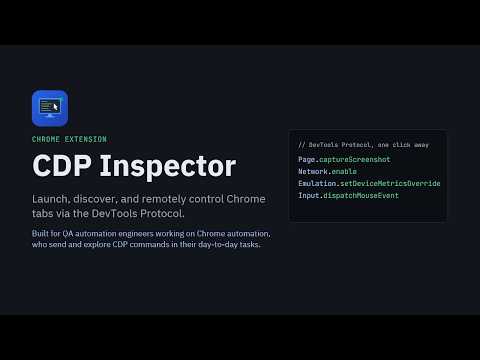
Launch, discover, and remotely control Chrome tabs via the DevTools Protocol.
CDP Inspector — Remote Chrome DevTools Protocol Control Center See, control, and debug your Chrome test sessions from another browser window. CDP Inspector connects to Chrome through the Chrome DevTools Protocol (CDP). Watch a live screencast, interact with the page, inspect HTTP traffic, run JavaScript, and send protocol commands from one dark-themed workspace. Use it with headless or GUI Chrome started with --remote-debugging-port. 📖 PRODUCT GUIDE Setup walkthroughs, screenshots, AI use cases, and troubleshooting: https://ajoealex.github.io/cdp-inspector-docs/ 🎯 WHY USE CDP INSPECTOR? When an automated browser run fails, a log message rarely tells the whole story. You need to see the page, inspect the requests, and try the interaction yourself. CDP Inspector gives QA engineers, automation developers, and browser-agent builders a visual way to investigate a running Chrome session. Watch what your script sees, take over an interaction, test a header or device setting, and capture evidence without setting up screen-sharing software. Connect using a localhost debugging port. For Chrome running in a container, CI environment, or another machine, first make its debugging endpoint accessible through localhost, for example with port forwarding. ✨ KEY FEATURES 🚀 Launch command generator Generate and copy Chrome commands for Windows, macOS, or Linux with OS detection, a random port (9000–9999), a separate profile, and headless/GUI modes (headless by default). Manage binary paths per OS and arguments per binary. Settings regenerate the command and sync the port field; Generate new refreshes it on demand. Includes shell-generated profile IDs, syntax highlighting, copy confirmation, and a profile cleanup reminder with a copyable folder path. 🔎 Browser and tab discovery Enter a localhost debugging port to list debuggable pages and iframes, with titles, URLs, type badges, a tab count, and copyable WebSocket debugger endpoints. View browser, protocol, user-agent, V8, and WebKit version details, plus file-path style when supplied by Chrome. Copy the browser-level WebSocket debugger URL for other CDP tools. Create a remote tab with a URL or leave the URL blank for a blank tab. Close remote tabs, attach through CDP Inspector, or open Chrome's DevTools frontend. Attaching also attempts to activate the selected tab in the remote browser. From the attached inspector, Close tab closes the remote target and then closes its inspector view after a five-second countdown. 🔌 Connection management Connect, disconnect, fetch tabs, or reconnect to refresh browser details and tabs. The port field validates port numbers and offers the five most recent ports with matching suggestions. The popup attempts to reconnect when reopened after a connected session. Periodic browser-reachability checks and connection indicators show when a browser becomes unavailable. Each attached inspector also has a read-only WebSocket address and a Disconnect control. 🖥️ Live remote screencast Watch the attached page update through CDP's screencast stream. Use Fit or 100% viewing modes, pause and resume the stream, or save the current frame as a JPEG image. Live, Paused, and Offline indicators show the session state. The address bar follows links, redirects, form submissions, and single-page application navigation, with URL entry, back, forward, and reload controls. Enter a hostname without a scheme to navigate using HTTPS. 🖱️ Mouse, touch, and keyboard control Forward left-, middle-, and right-button events, pointer movement, dragging, wheel scrolling, and keyboard input with modifier keys to the attached page. Switch between mouse and touch interaction, and show the remote x/y coordinates and input event type when diagnosing behavior. Keyboard input is forwarded while the pointer is over the screencast, with a visual capture highlight; moving it away returns typing to the inspector UI. Native single-row select dropdowns are presented as interactive overlays, including grouped options, selected values, and disabled options. JavaScript alerts, confirmations, prompts, and leave-page dialogs are handled through the inspector's dialog controls. Accept or dismiss dialogs and supply a response for prompts. 🌐 HTTP network inspection Enable or disable network logging to capture HTTP(S) requests with method, status, URL, resource type, size, start time, and duration. The list keeps the most recent 1,000 requests. Compact rows show the endpoint path and query; hover or expand to see the full URL. Expand requests to inspect redirect chains, failed or canceled requests and their error details, and request/response headers, including additional headers reported by Chrome's network stack when available. Filter by URL or method, export captured logs as JSON with headers and redirect details, or clear the request list. Turning logging off keeps captured entries available for inspection and marks unfinished requests as canceled. If Chrome rejects a logging toggle, an inline error explains the failure. The Network tab excludes WebSocket connections and frames. 🧩 Custom HTTP headers Add, edit, or remove request-header rows, or use bulk JSON editing. Switch between table and JSON views, with inline validation for invalid JSON objects. Apply headers through Network.setExtraHTTPHeaders and see a Custom headers set indicator and an Edit custom headers button while a non-empty custom header set is active. Closing and reopening the editor preserves your in-progress edits. Clear headers removes the custom header set and resets both editors, so the next Add custom headers dialog starts empty. Clear requests separately clears the captured request list. ⌨️ Raw CDP command console Send protocol commands with method-name autocomplete from a bundled method catalog. Selecting a suggested method fills in a JSON skeleton for its required parameters. Enter optional JSON parameters, see validation errors before sending, clear the composer, and follow a link to the CDP documentation. Deprecated methods are marked inline with explanatory text when available. The catalog works without fetching an online reference; command availability depends on the connected Chrome version. Request IDs are assigned automatically, with the next ID displayed in the composer. IDs wrap from 50,000 back to 1 while avoiding IDs still awaiting responses. 🧾 Searchable command, response, and event logs Inspect timestamped sent commands, responses, and events in the Message tab, with visual distinctions for outgoing messages and errors. Expand or collapse entries and select their text. Search the log, hide screencast and input traffic, export stored history as JSON, or clear it. Adjust the message-history limit or reset it to 1,000. Responses and screencast/input traffic have separate histories, so hidden input events do not evict command responses. Preset and header actions show the sent command's ID with a View response shortcut to the Message tab. 📸 Screenshot presets Download PNG, JPEG, or WebP screenshots of the attached page. Set JPEG/WebP quality from 0–100 and optionally capture beyond the viewport for a full-page screenshot. Saving the current screencast frame is also available separately. 📱 Device and viewport emulation Choose built-in iPhone 15, iPad Air, Pixel 8, or Desktop profiles, or use the detected Connected browser profile. The connected profile reads the attached page's actual viewport, device pixel ratio, user agent, mobile setting, and touch capability, and refreshes as the page changes. Create a named custom profile by copying settings from a built-in, connected-browser, or saved profile. Edit width, height, device pixel ratio, mobile mode, touch support, and an optional user-agent override. Settings are validated before saving, with duplicate profile names rejected. Edit or delete saved custom profiles; changes are shared across open inspector tabs. Apply a profile to set viewport metrics, touch emulation, and user agent together. Clear emulation removes the viewport and user-agent overrides and disables touch emulation. 📍 Location emulation Override latitude, longitude, and accuracy in meters to test location-dependent behavior. Input validation checks coordinate ranges and accuracy before applying. Clear location removes the override. The remote page still needs permission to access location when prompted. 🧪 Execute JavaScript Run JavaScript in the attached page through Runtime.evaluate and read its return value or error in a dedicated, read-only Result box. Clear the script and result together when starting a new experiment. The default async IIFE wrapper supports return statements and await, catches and logs script errors to the page's console, and displays errors in the Result box. Wrapped results support JSON-friendly values, arrays, plain objects, and DOM elements represented by their tag and attributes; unsupported or unserializable values fall back to an unparsable object message. Turn the wrapper off to run a bare expression directly, and choose whether to await its Promise. Await promise is forced on while the async wrapper is enabled. 🔐 HTTP authentication handling Respond to server or proxy authentication challenges through a username/password dialog, or cancel the challenge. The dialog shows the origin, authentication scheme, and realm when supplied. Challenges are queued for handling through CDP's Fetch domain. Submitted authentication usernames and passwords are redacted from the inspector's command history and its JSON export. 🤖 AI-assisted debugging handoff Copy a ready-to-paste debugging prompt containing the tab's details and CDP WebSocket endpoint. The prompt follows the page URL as it changes. Share it with your chosen AI coding agent to give it the connection details for a live debugging session. 💾 Everyday conveniences Keep your launch command, debugging port, OS selection, headless and random-variable preferences, recent ports, custom binary paths and their selections, custom arguments, saved device profiles, and popup connection state between sessions. Copy buttons provide visual confirmation. The dark-themed inspector keeps the screencast alongside the Message, Presets, and Network tabs. Drag the divider to resize the panels, or focus it and use the left/right arrow keys. The layout stacks panels on narrower windows, and each tab's content scrolls within its panel. ⌨️ Keyboard shortcuts - Popup: Ctrl+R or Cmd+R reconnects and refreshes browser details and tabs. - Debugging port: Up/Down selects a recent-port suggestion; Enter accepts it or connects when none is highlighted; Escape closes suggestions. - CDP method field: Up/Down navigates suggestions, Enter fills the selected method and required parameters, and Escape closes suggestions. - Address bar: Enter navigates; Escape cancels the edit and restores the current URL. - Panel divider: Left/Right adjusts panel widths. - Select overlays: Escape closes the overlay. 🤖 AI USE CASES Start with the copied debugging prompt, then give your CDP-capable AI agent a task: - Debug a live app: Reproduce a bug, inspect the DOM and console, investigate requests, and verify a fix while watching the screencast. - Analyze dashboards: Extract page tables or visible report data, summarize findings, and create an Excel spreadsheet using an external reporting tool. - Compare products: Gather prices, specifications, ratings, and source links; consult independent reviews; then build a comparison with pros and cons. - Check responsive layouts: Inspect a page across device profiles and capture screenshots for a visual QA report. - Test user journeys: Walk through signup or test checkout flows and use the Network tab to investigate failed requests. - Audit content and SEO: Inspect page titles, headings, and metadata, then compile findings across your own pages. AI execution, spreadsheet creation, and image comparison use your chosen external tools. CDP Inspector provides the debugging connection and live browser view. 👥 WHO IT'S FOR - QA and test engineers investigating browser test failures. - Automation and RPA developers inspecting a running workflow. - Developers debugging headless Chrome or containerized test sessions. - Teams using CI-hosted browsers with a debugging endpoint forwarded to localhost. - AI browser-agent builders who need visual inspection and a shareable CDP endpoint. 🔒 PERMISSIONS & PRIVACY The extension requests: - storage — saves settings and custom device profiles locally in Chrome. - Host access to http://localhost/* — discovers browsers and tabs and performs browser-management requests on the debugging port you select. No account or hosted backend is required. The extension does not include analytics or tracking services. CDP commands and session data travel directly between the extension and the selected debugging endpoint. The inspected browser continues to make its own website requests. Custom header drafts and request/message logs stay in memory for the open inspector page and are not saved across page reloads. Exporting logs or saving screenshots creates files you choose to keep. 🏁 GETTING STARTED 1. Open the extension and choose your OS, Chromium binary path, and optional launch arguments. 2. Choose headless or GUI mode, generate a launch command, and copy it. 3. Run the command in Command Prompt on Windows, or a shell such as Bash on macOS/Linux. 4. Enter the matching localhost debugging port and click Connect or Fetch tabs. 5. Click a tab's Attach via CDP button to open its live inspector. 6. Interact with the screencast, send commands, apply presets, or enable network logging and custom headers. 🧭 SCOPE CDP Inspector is built for development, QA, and automation workflows. Use it only with Chrome instances you control or are authorized to test. Keep debugging endpoints private and dedicate generated browser profiles to testing. Close Chrome instances using those profiles before cleaning up their profile folders.
0 out of 5No ratings
Details
- Version2.1.0
- UpdatedNovember 9, 2026
- Size250KiB
- LanguagesEnglish (United States)
- DeveloperWebsite
Email
ajoealex316@gmail.com - Non-traderThis developer has not identified itself as a trader. For consumers in the European Union, please note that consumer rights do not apply to contracts between you and this developer.
Privacy

This developer declares that your data is
- Not being sold to third parties, outside of the approved use cases
- Not being used or transferred for purposes that are unrelated to the item's core functionality
- Not being used or transferred to determine creditworthiness or for lending purposes