


總覽
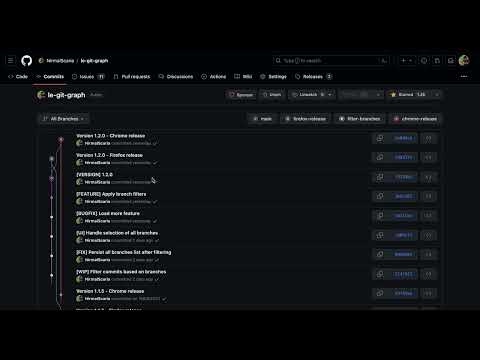
A browser extension that displays the git graph for any GitHub repository.
Calling all GitHub enthusiasts! Elevate your coding prowess with our exceptional browser extension, "Le Git Graph" – the ultimate tool that transforms your GitHub journey into a captivating visual spectacle. 🚀 Embrace Visual Clarity: Integrating seamlessly into the GitHub website, "Le Git Graph" introduces a dynamic and interactive Git graph to your repositories. No more deciphering complex commit logs or struggling to make sense of intricate branching patterns. This extension unveils your version control history in a striking, user-friendly graph, making project navigation an absolute breeze. 🎨 A Work of Art: Behold the mesmerizing visual representation of your Git history with "Le Git Graph." Witness branches, merges, and commits come to life in an organized and aesthetically pleasing manner. Analyze project progress, identify code changes, and make informed decisions with unparalleled ease. 🔍 Intuitive Exploration: Experience GitHub navigation like never before! "Le Git Graph" empowers you to explore branches effortlessly, delve into commits, and seamlessly switch between versions. Uncover hidden relationships between code changes and gain valuable insights with just a few clicks. 🛠️ Empower Collaboration: Take collaboration to new heights! "Le Git Graph" facilitates seamless code reviews, efficient conflict resolution, and effective communication among team members. Boost productivity and build remarkable projects together, all while enjoying the delightful visual experience. ⚙️ Hassle-Free Setup: Getting started is a breeze! Download "Le Git Graph" from your browser store, and instantly elevate your GitHub interface with this powerful extension. Lightweight, dependable, and compatible with major browsers, it ensures a smooth coding journey from the get-go. ⭐ Embrace the Revolution: Step into the future of GitHub collaboration and unleash the true potential of your repositories with "Le Git Graph" extension. Experience coding productivity like never before! 👉 Don't miss out on this game-changing tool – download "Le Git Graph" now and embark on an awe-inspiring coding adventure! Happy coding! #GitHub #GitGraph #LeGitGraph #BrowserExtension #CodeVisualization #DeveloperTools #CodingJourney #ProductivityHacks #OpenSource
4.5 分 (滿分 5 分)34 個評分
詳細資料
隱私權

「Le Git Graph - Commits Graph for GitHub」已揭露下列關於收集及使用資料的資訊。 如需更多詳細資訊,請參閱開發人員的《privacy policy》。
Le Git Graph - Commits Graph for GitHub 會處理下列資料:
這位開發者就你的資料做出下列聲明:
- 除經核准的用途外,不會將你的資料販售給第三方
- 不會基於與商品核心功能無關的目的,使用或轉移資料
- 不會為了確認信用度或基於貸款目的,使用或轉移資料
支援
如有疑問或建議,請使用電腦版瀏覽器開啟這個頁面