


Tổng quan
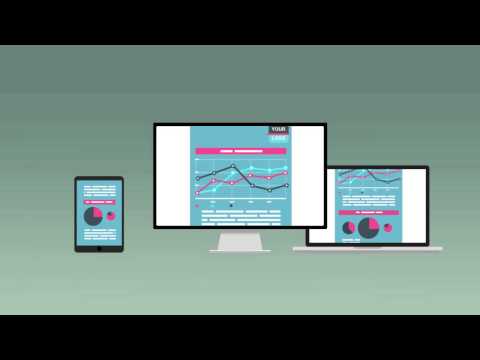
Make beautiful animated charts, graphs and reports online - no coding skills required.
Make beautiful animated charts, graphs and reports online - no coding skills required. Create stunning, professionally looking, animated charts, graphs and reports in a few minutes. Get started for free or upgrade access the full power of Infogram. With Infogram you can create and publish beautiful, interactive charts, graphs and reports based on any data you choose. Select a template, upload or enter your data for various graph types, add quotes, images and text, and decide the layout with a simple drag and drop interface. Keep your charts up-to-date in real time with Google Sheets. For Teams: -Real-time collaboration -Role-based access -Team libraries and folders For Enterprises: -Self-hosted files -Private sharing -Custom-made design themes Share and publish easily: -Download as PDF, PNG and JPG -Embed charts in blogs or websites -Post directly to social media Turn your data into stories that sell, quickly and easily, and share them as you would share a photo. Join now and discover a whole new way of presenting your data.
3,3/534 lượt xếp hạng
Chi tiết
- Phiên bản2.0.4
- Đã cập nhật16 tháng 6, 2017
- Kích thước5.15KiB
- Ngôn ngữEnglish
- Nhà phát triển
- Người bán phi thương mạiNhà phát triển này không tự nhận mình là người bán. Đối với người tiêu dùng ở Liên minh Châu Âu, xin lưu ý rằng các quyền của người tiêu dùng không được áp dụng trong hợp đồng giữa bạn và nhà phát triển này.
Quyền riêng tư

Hỗ trợ
Nếu bạn có câu hỏi, ý kiến đề xuất hoặc gặp vấn đề, vui lòng mở trang này bằng trình duyệt dành cho máy tính để được trợ giúp