


개요
Make beautiful animated charts, graphs and reports online - no coding skills required.
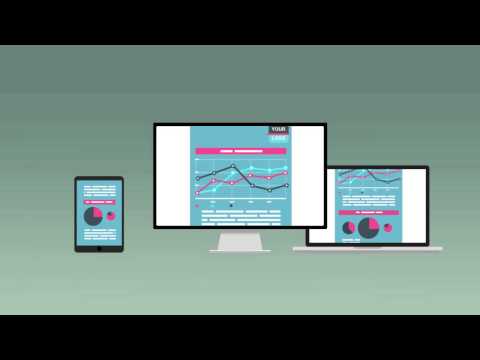
Make beautiful animated charts, graphs and reports online - no coding skills required. Create stunning, professionally looking, animated charts, graphs and reports in a few minutes. Get started for free or upgrade access the full power of Infogram. With Infogram you can create and publish beautiful, interactive charts, graphs and reports based on any data you choose. Select a template, upload or enter your data for various graph types, add quotes, images and text, and decide the layout with a simple drag and drop interface. Keep your charts up-to-date in real time with Google Sheets. For Teams: -Real-time collaboration -Role-based access -Team libraries and folders For Enterprises: -Self-hosted files -Private sharing -Custom-made design themes Share and publish easily: -Download as PDF, PNG and JPG -Embed charts in blogs or websites -Post directly to social media Turn your data into stories that sell, quickly and easily, and share them as you would share a photo. Join now and discover a whole new way of presenting your data.
5점 만점에 3.3점평점 34개
세부정보
개인정보 보호
지원
질문, 제안 또는 문제와 관련하여 도움이 필요하면 데스크톱 브라우저에서 이 페이지를 여세요.