

Aventus Jira Metrics
2 ratings
)
Overview
Flow metrics for Aventus Jira boards: Lead Time, Cycle Time, Throughput, Flow Efficiency and Aging WIP, plus CFD and aging charts.
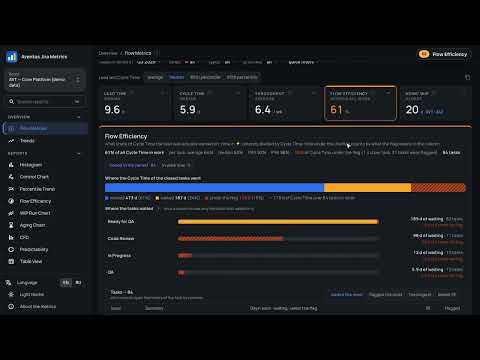
Aventus Jira Metrics adds a "Flow Metrics" button to Aventus Jira boards and opens a report with the five team flow metrics: • Lead Time — how long the business waits for a task: from the point you choose (task creation or a column) until done. • Cycle Time — time in work, from the moment the team took the task until done. • Throughput — tasks finished per week, per month or per two months. • Flow Efficiency — the share of all the Cycle Time that was actual work, not waiting in queues or under a flag. • Aging WIP — the age of the oldest task in progress, shown with its key, and the full list of tasks in work. Set the board up once: every column gets one role — not taken yet, worked on, waiting or done. Per column you also say what the Jira flag means, and which resolutions count as done. The report remembers it. When the board changes later, it notices: a renamed column keeps its settings, a new one is marked for you to check, and if the column Lead Time started from is gone, Lead Time is not counted until you pick the start again. Filters read like a sentence: tasks finished in a period, lanes, types, priorities, quick filters. The period is a preset, a quarter or your own dates on a calendar, and it goes into the page address, so the link can be shared. The switch above Lead Time and Cycle Time sets their measure: the median (by default), P85, P95 or the average. Click a number to open its panel: the Lead Time or Cycle Time distribution (drag across the bars to see those tasks and who did them), clickable Throughput bars with a forecast under them, what the Cycle Time is made of and where the tasks waited, every task in work with its age against ½ P85, P85 and P95. Throughput forecast: "in the next week with 85% probability we close at least N tasks (95% — at least M)", for a week, two weeks or a month. A Monte Carlo simulation over the daily Throughput of the chosen period, with all the filters applied. Task history: every task list shows a ribbon by column — work, waiting, time under the flag. Click a row for the dates of the moves, the days in each column and who moved the task. Needs attention (Health check): only the points you can act on — what is wrong, on which tasks, what to do. English and Russian; copy it into a report with one click. History reports for the last 3, 6 or 12 months, by month or by week: • Trends — all five metrics period by period; the last full period is compared with the earlier ones. • Control Chart — every finished task as a dot, with percentile lines. • Percentile Trend — P50/P70/P85/P95 of Cycle or Lead Time over time. • Flow Efficiency — the trend and the columns where the waiting happens. • WIP Run Chart — work in progress day by day, by column. • Aging Chart — tasks in work as dots, column by age, against the thresholds. Also included: histogram, cumulative flow diagram, predictability chart and task table. A "?" next to every number and chart explains what it is, how to read it, what to do about it and how it is counted; the About the metrics page gathers all of them. Tables export to CSV, and the KPI summary copies as text for reports. A sidebar with a board picker and report search (Cmd/Ctrl+K), a dark theme that follows your system, and the whole interface in English or Russian. New in 1.4. Column roles replace the separate start, Done and active columns (old settings carry over). The Jira flag counts as waiting, the median is the default measure, every task list opens the task's history, filters read as a sentence with quarters and a calendar, and the Aging Chart shows the thresholds. After the update some numbers change: Lead Time and Cycle Time start again when a task goes back to the backlog, Flow Efficiency gets lower on boards that use flags, and the Aging WIP card always shows the oldest task. New in 1.4.2. The Throughput forecast. The report notices changes of the board. The Flow Efficiency card counts all the work together — the active time of all tasks divided by their Cycle Time — so the number may differ from the per-task median it showed before; the per-task average, median and percentiles are in the panel. Built for Aventus teams: works on the two Aventus Jira servers (jira.aventus.work and jira.agis.work) and asks for access to those sites only. All data is read from Jira with your own session and processed locally in the browser; nothing is sent anywhere else. No analytics, no tracking. Based on the open-source Jira Metrics Plugin by Anvar Khakimov (Apache 2.0).
3 out of 52 ratings
Details
- Version1.4.2
- UpdatedOctober 8, 2026
- Offered byMARKAROV.DEV
- Size750KiB
- Languages2 languages
- DeveloperMARKAROV DEV
Stanisława Kunieckogo 53 1 Wrocław 55-616 PLEmail
support@markarov.dev - Non-traderThis developer has not identified itself as a trader. For consumers in the European Union, please note that consumer rights do not apply to contracts between you and this developer.
Privacy

This developer declares that your data is
- Not being sold to third parties, outside of the approved use cases
- Not being used or transferred for purposes that are unrelated to the item's core functionality
- Not being used or transferred to determine creditworthiness or for lending purposes
Support
For help with questions, suggestions, or problems, please open this page on your desktop browser