


Overview
Scan NSE stocks for Stage 2 uptrends, VCP breakouts, 52-week highs & volume surges. One-click momentum screener for Indian markets.
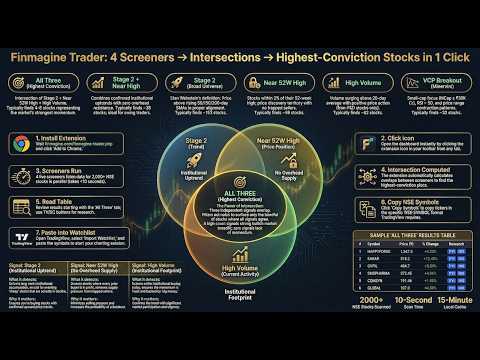
Finmagine Trader — NSE Momentum Scanner ======================================== Scan every NSE-listed stock in seconds. Finmagine Trader runs institutional-grade momentum screeners simultaneously and surfaces the strongest setups — so you spend your time analysing, not scanning. Whether you are an active swing trader or a long-term investor, Finmagine Trader tells you which stocks are in confirmed uptrends, getting institutional attention, and pressing new highs — right now. Use it to find new ideas, validate stocks on your watchlist, or simply stay on the right side of the market. Full documentation, guide, and tutorials: https://finmagine.com/finmagine-trader.php ── WHAT IT DOES ────────────────────────────────────────── One click. Live data. Eleven focused tabs: ⭐ All Three — Stage 2 + Near 52W High + High Volume. All three signals firing at once. Highest conviction momentum setups. 🚀 Stage 2 + Near High — Minervini Stage 2 uptrend with no overhead resistance. Pre-breakout watchlist. 📈 Stage 2 — Full Stage 2 universe. All moving averages in order and rising. The complete momentum field. 🎯 Near 52W High — Within 2% of annual high. Breakout candidates across all market caps. 📊 High Volume — Volume surging above 20-day average on an up day above SMA 50. Fresh institutional interest signal. 💎 VCP Breakout — Volatility Contraction Pattern. Small-to-mid cap, above 50/200 SMA, RSI > 50, no derivatives. Minervini-style positional plays. 📐 3-Week Tight — Three consecutive weekly closes within 1.5% of each other, SMA 50 above SMA 200. Tight consolidation before the next breakout. 🏷️ BRS — Breakout Readiness Score for every Stage 2 stock. Composite 0–100 score across five signals: Trend Template · Relative Strength vs Nifty · Proximity to high · Stage · Breakout Quality. Five tiers: 🔥 Elite Breakout (95+) · 🥇 Breakout Ready (85–94) · 🟢 Setup Forming (70–84) · 🟡 Early Stage (55–69) · ⬜ Avoid (<55). 🪤 Bottom — Stocks more than 50% off their 52-week high with proven historical momentum, now forming a tight NR7 consolidation. Beaten-down names coiling for a potential reversal. BRS score shown for every result — use it to separate genuine recovery candidates from value traps. 🌟 IPO Breakout — Stocks listed in the last 365 days. Price > ₹25, MCap ≥ ₹300 Cr, 50-day average turnover ≥ ₹5 Cr. Review each chart for a U-base forming below the first-day high — enter when price closes above it. 🔊 Volume — Stocks hitting Highest Volume Quarter (HVQ), Year (HVY), Decade (HVD), or Ever (HVE) today on an up day. Institutional accumulation signal. HVE = strongest conviction; HVD = decade high; HVY = very strong; HVQ = notable. 🐂 Bull Snort filter: volume ≥ 3× 50-day average AND close in the top 25% of the day's range — strong closes with conviction. Stage · RS · BRS shown on every row. ── KEY FEATURES ────────────────────────────────────────── • BRS score — Breakout Readiness Score (0–100) ranks every Stage 2 stock by setup quality across 5 signals • Stage badge — every stock shows Stage 1 / 2 / 3 / 4 classification based on full Minervini moving average hierarchy • Relative Strength — RS score (0–100) vs Nifty 50 over 12 months; outperformers rank highest • Trend Template — TT ✓ badge confirms Minervini's 8-point institutional-grade momentum filter • BRS ribbon — Screener.in signals bar now shows BRS score, Stage, and TT status inline • PM Watchlist button — "★ PM" on every row adds the stock to Portfolio Manager Watchlist in one click • AI Advisor integration — signals bar in Finmagine AI Advisor shows live Trader scan results for every Screener.in stock • Background auto-refresh — scans update every 6 hours automatically, even with popup closed • 3-Week Tight tab — dedicated scan for weekly consolidation setups • Turnover column — ₹ Cr daily turnover (volume × close), sortable, CSV exported • Near-pivot watchlist alerts — toast notification when watchlisted stocks enter Near 52W High scan • Tight Volatility filter — show only stocks with contracting ATR: ATR(14) below ATR(50) • Sector grouping bar — see which industries dominate each scan; click to filter by sector • Live market data — updated on every refresh • 15-minute smart cache — instant reopens, always current • Index filter — restrict scans to Nifty 50 / 100 / 200 / 500 universe • Market cap filter — filter from ₹500 Cr to ₹50,000 Cr in one click • Score filter — show only Score ≥ 1 / ≥ 2 / ≥ 3 / = 4 setups • Signals column — see which scans each stock passes (S2 / NH / HV / VCP) • Score pill — count of signals (1–4). Higher = stronger conviction • Watchlist — star stocks, toggle to watchlist-only view • Search — filter by symbol or company name instantly • Copy Symbols — one click copies all symbols for TradingView watchlist import • Export CSV — download full results for offline analysis • Open In — click any row to open TradingView chart; SC for Screener.in; SS for StockScans • Column sort — click any column header to sort • ETF excluded — index ETFs automatically filtered out ── WHO IS IT FOR ────────────────────────────────────────── 🔁 Active traders — find high-conviction swing and positional setups every morning in under 5 minutes. 📈 Long-term investors — discover quality stocks in confirmed uptrends with institutional backing. Check whether a stock you already own is still in Stage 2. Identify new ideas by seeing what the market is rewarding right now. 📊 Market observers — get a daily pulse on which sectors and stocks are showing strength, without needing to be a technical expert. ── HOW TO USE ────────────────────────────────────────── 1. Click the Finmagine Trader icon in your Chrome toolbar 2. Data loads automatically — results appear within a few seconds 3. Start with ⭐ All Three for the day's highest-conviction setups 4. Narrow to an index (e.g. Nifty 500) to focus on quality names only 5. Use Score ≥ 3 to surface the strongest multi-signal setups 6. Enable Tight Volatility to see only stocks coiling before a potential breakout 7. Sort by Turnover to focus on the most liquid setups 8. Use 📐 3-Week Tight for stocks in tight consolidation before a breakout 9. Use 💎 VCP Breakout for positional trade candidates 10. Use 🌟 IPO Breakout to catch new listings pressing all-time highs 11. Click any row to open the TradingView chart 12. Star stocks to build your watchlist; Copy Symbols to import into TradingView Full guide with scan logic, strategy explanations, and examples: https://finmagine.com/finmagine-trader.php ── SCAN METHODOLOGY ────────────────────────────────────────── All scans are based on publicly documented momentum and trend-following frameworks: Stage 2 — Mark Minervini's Stage Analysis (price above rising 50/150/200 SMA in correct order, near 52-week high range, liquid) Near 52W High — Within 2% of annual high, price ≥ ₹20, MCap > ₹500 Cr High Volume — Volume > 20-day average, price up >1% today, above SMA 50, non-F&O VCP — Volatility Contraction Pattern per Minervini: small/mid-cap, above 50/200 SMA, RSI > 50, no derivatives, up today 3-Week Tight — Three consecutive weekly closes within 1.5% of each other, SMA 50 above SMA 200 IPO Breakout — Listed within last 365 calendar days + Price > ₹25 + MCap ≥ ₹300 Cr + 50-day avg turnover ≥ ₹5 Cr Tight Volatility — ATR(14) below ATR(50): short-term volatility contracting relative to recent history BRS — Breakout Readiness Score: TT (25 pts) + RS vs Nifty (25 pts) + Proximity to 52W high (20 pts) + Stage (20 pts) + Breakout Quality (10 pts) = 100 ── WHAT'S NEW IN v2.5.0 ────────────────────────────────────────── 🌟 IPO Breakout tab fixed — The tab was always returning zero results due to two bugs in the underlying scan logic. First, the IPO detection condition used an undefined SMA comparison that ChartInk treated as null, causing every stock to fail the filter silently. Second, the breakout condition required the stock to be within 2% below its 52-week high — but IPO stocks in their base phase typically sit 20–40% below the listing-day spike, so the threshold never fired. The scan now correctly identifies stocks listed in the last 365 calendar days (detected by absence of price data 365 days ago) that meet the liquidity bar: Price > ₹25, MCap ≥ ₹300 Cr, 50-day average turnover ≥ ₹5 Cr. 📜 Tab bar scrolling — With more tabs than fit the screen, the tab bar now scrolls horizontally. A visible scrollbar appears at the bottom of the tab row, and clicking any tab automatically scrolls it into view. ── WHAT'S NEW IN v2.4.2 ────────────────────────────────────────── 🔢 Volume tab count badge fix — The count badge on the Volume tab was showing (0) even when the tab was fully populated. Volume data loads in a second background pass after the main scan; the badge now updates correctly once that pass completes. 🐂 Bull Snort fix — The closing-strength check ((close − low) / (high − low) ≥ 0.75) is now enforced directly inside the ChartInk scan query, where intraday OHLC data is available. Previously the check ran client-side against fields not returned by the ChartInk API, causing all volume ≥ 3× average stocks to pass regardless of closing position. Stocks like Sobha and Tata Tech that did not close in the top 25% of their day's range will no longer appear. ── WHAT'S NEW IN v2.4.1 ────────────────────────────────────────── (Superseded by v2.4.2 — changes included above.) ── WHAT'S NEW IN v2.4.0 ────────────────────────────────────────── 🐂 Bull Snort filter — A new sub-filter chip on the Volume tab surfaces the strongest closes: volume ≥ 3× the 50-day average AND the stock closes in the top 25% of the day's high-low range. These are stocks closing strong with real conviction behind the move — not just a volume spike that fades. Suggested by @karanshah137 on ValuePickr. 📅 HVD — Highest Volume Decade — A new fourth volume tier looking back 10 years (2,520 trading days). Sits between HVY and HVE in the hierarchy. Stocks hitting HVD on an up day have not seen this level of buying in a decade. Badge colour: purple. 📈 HVE extended — Highest Volume Ever lookback extended from ≈8 years (2,000 days) to ≈15 years (3,750 days). HVE signals are now compared against the longest available history for each stock, making them significantly more meaningful. 📊 Stage · RS · BRS on Volume tab — Every Volume tab result now shows the Weinstein Stage badge (S1/S2/S3/S4), Relative Strength vs Nifty arrows (3M/6M/12M), Breakout Readiness Score (0–100), and BRS Tag. The killer combo: HVE or HVD + Stage 2 + BRS ≥ 70 = institutional event in a confirmed uptrend — now visible in a single row. 🏷 Sub-filter chips updated — All | HVE | HVD | HVY | HVQ | 🐂 Bull Snort, with live counts per tier. ── WHAT'S NEW IN v2.3.0 ────────────────────────────────────────── 🔊 Volume Tab — New dedicated tab for institutional volume signals. Three tiers: HVQ (Highest Volume Quarter — 63-day max), HVY (Highest Volume Year — 252-day max), HVE (Highest Volume Ever — ≈8 years). Mirrors the @finallynitin "Simple Volume with Pocket Pivots" scanner on ChartInk. BUY-direction only — only up days qualify. Liquidity-filtered: (50-day avg vol × price) > ₹50L. Price ≥ ₹20, MCap ≥ ₹100 Cr. 🏷 HVE / HVY / HVQ badges — gold / green / blue colour-coded badges on every row. HVE > HVY > HVQ hierarchy: if a stock qualifies for multiple tiers, only the strongest is shown. 🔎 Sub-filter chips — All | HVE | HVY | HVQ chips in the filter bar let you isolate a signal type in one click. Counts shown per tier. ⚡ Two-stage loading — Volume scans are heavy ChartInk queries. All existing tabs load instantly; volume data loads asynchronously in the background with a loading indicator. ── WHAT'S NEW IN v2.2.0 ────────────────────────────────────────── 🪤 Bottom Tab — broader scan: ADR% filter removed. The scan now surfaces all stocks >50% off their 52-week high with proven historical momentum — without the ADR% constraint that was artificially limiting results. Use BRS to rank what you see; the scan's job is to find the candidates, BRS's job is to separate them. 📐 Bottom momentum logic updated — the "any one momentum signal" filter now matches the original scanner exactly: 3+ days >15% gain in last 720 days, OR 4+ days >10% in last year, OR 2+ days >10% in last 60 days, OR 2+ days >7% in last 20 days, OR NR7 consolidation today or yesterday. More stocks surface; BRS does the filtering. ── WHAT'S NEW IN v2.1.0 ────────────────────────────────────────── 🪤 Bottom Tab — A new dedicated scan surfaces stocks more than 50% off their 52-week high that have a proven history of explosive momentum and are now forming a tight NR7 consolidation (narrowest daily range in 7 days). These are deeply beaten-down names coiling for a potential reversal — not random dip picks. BRS score shown for every result — use it to separate genuine recovery candidates from value traps. 📊 BRS on Bottom Tab — Every Bottom result shows its Breakout Readiness Score prominently. Favour stocks with BRS ≥ 40 for higher-conviction setups. Stocks with BRS < 25 are flagged with a ⚠ warning badge. ── WHAT'S NEW IN v2.0.0 ────────────────────────────────────────── ✨ AI Advisor per-stock button — every stock row now has a ✨ AI button in the actions column. One click opens the stock's Screener.in page and the Finmagine AI Advisor panel fires automatically — from momentum scan to AI analysis in a single click, no copy-pasting required. 🔗 AIA install detection — Trader now checks whether Finmagine AI Advisor is installed. If it is, the ✨ AI button appears. If not, a dismissible banner at the top of the popup explains the integration and links to the AI Advisor install page. Banner is session-dismissed — it does not reappear until the next session. 💡 Stage 2 → Growth Triggers shortcut — if a stock in the scan shows a Stage 2 signal, the AI Advisor panel on its Screener.in page surfaces a direct CTA to run the Growth Triggers template — bridging the momentum signal to the fundamental catalyst question in one click. ── WHAT'S NEW IN v1.9.1 ────────────────────────────────────────── 🔧 BRS Rules section was empty when expanded — now shows the full scoring breakdown for all 5 components (TT · RS · Proximity · Stage · Breakout Quality) with exact point values and thresholds. 📈 BRS floor for 52W High stocks — a stock within 2% of its 52-week high is now tagged Early Stage (55) minimum, never Avoid. A stock pressing its annual high has broken through overhead supply; labelling it Avoid regardless of historical RS was misleading. The fix ensures the BRS tag reflects price reality. ── WHAT'S NEW IN v1.8.0 ────────────────────────────────────────── 📊 BRS — Breakout Readiness Score — A new dedicated tab ranks every Stage 2 stock on a 0–100 composite score built from five independently-weighted signals: Trend Template compliance (25 pts), Relative Strength vs Nifty 50 (25 pts), Proximity to 52-week high (20 pts), Stage classification (20 pts), and Breakout Quality indicators (10 pts). Five tiers tell you exactly where a stock stands: 🔥 Elite Breakout (95+) · 🥇 Breakout Ready (85–94) · 🟢 Setup Forming (70–84) · 🟡 Early Stage (55–69) · ⬜ Avoid (<55). The BRS tab shows a full 16-column detail view; all other tabs show a compact BRS column. 🏷 Stage Classification — Every scan result now shows a Stage 1 / 2 / 3 / 4 badge based on the complete Minervini moving average hierarchy. Not just a binary Stage 2 filter — you see the full lifecycle context for every stock you review. 📈 Relative Strength vs Nifty — Each stock carries an RS score (0–100) measuring 12-month price performance against Nifty 50. Stocks that have consistently outperformed the index rank highest. Replaces guesswork with a precise, comparable outperformance ranking across the entire universe. ✅ Trend Template — Every stock is evaluated against Minervini's 8-point Trend Template. The TT ✓ badge means a stock passes all eight criteria simultaneously — the strictest
5 out of 53 ratings
Details
- Version2.5.1
- UpdatedJune 15, 2026
- Size82.81KiB
- LanguagesEnglish (United States)
- DeveloperFinmagineWebsite
1, SBI Officers Colony, 2nd Street, Arumbakkam Chennai, Tamil Nadu 600106 INEmail
ipersist@gmail.com - Non-traderThis developer has not identified itself as a trader. For consumers in the European Union, please note that consumer rights do not apply to contracts between you and this developer.
Privacy

This developer declares that your data is
- Not being sold to third parties, outside of the approved use cases
- Not being used or transferred for purposes that are unrelated to the item's core functionality
- Not being used or transferred to determine creditworthiness or for lending purposes
Support
For help with questions, suggestions, or problems, visit the developer's support site