

Finmagine Financial Chart Builder – Screener & Stock Analysis Tool

Visão geral
Charts for Screener.in, Google Finance, stockanalysis.com & Perplexity Finance. Health scores, DuPont Analysis & valuation verdicts.
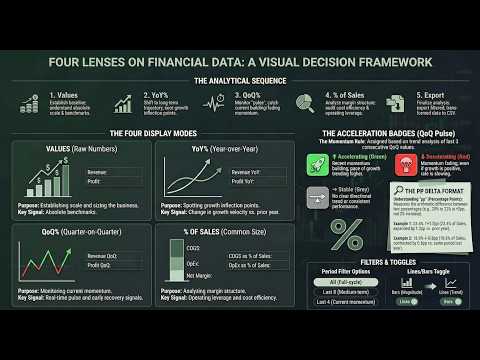
Finmagine Financial Chart Builder – Screener & Stock Analysis Tool ================================================================== Visualise, compare, and analyse financial data directly on Screener.in, Google Finance, stockanalysis.com, and Perplexity Finance — without leaving the page. Full guide, tutorials, and documentation: https://finmagine.com/chart-builder.php ── WHY FINMAGINE? ────────────────────────────────────────── Screener shows raw data. Finmagine turns it into insight. • Instantly see growth acceleration or deceleration across any metric • Compare margins and ratios historically — in seconds, on the same page • Detect valuation compression or expansion without a spreadsheet • Identify risk via drawdown, volatility, and Z-Score overlays • Avoid exporting to Excel — the analysis happens where the data lives Designed for serious long-term investors and data-driven traders. ── WHAT IT DOES ────────────────────────────────────────── One extension. Four financial platforms. Institutional-grade analysis. The Charts tab embeds a floating panel in the page — select any financial metric to plot it instantly. Mix Profit & Loss, Balance Sheet, Cash Flow, Ratios, and Shareholding data on a single chart. Line or bar, your choice. Quick Analysis — Instant health scores across Profitability, Solvency, Efficiency, Valuation, and Growth. Sector-aware benchmarks across 18 Indian sectors and 145+ GICS industries for US stocks. Calculated Ratios — Derived metrics that Screener doesn't show: DuPont decomposition, FCF Yield, ROCE, Incremental ROCE, EV/EBITDA, Capital Efficiency Score, and more. Price Analysis — CAGR across 1Y, 3Y, and 5Y periods. Indian Investor Returns in both INR and USD. Cyclical analysis, drawdown, RSI, Beta, and Altman Z-Score. Valuation — Intrinsic value models including Reverse DCF, Graham Number, PEG-adjusted fair value, and a Scenario DCF with three growth cases. Sourced directly from Screener's chart API. ── KEY FEATURES ────────────────────────────────────────── • Four display modes: Values | YoY % | QoQ % | % of Sales • Chronological growth columns with raw anchor baseline • Lines / Bars global toggle + per-metric chart type override • Acceleration (⚡ ACC) and deceleration (⚠ DEC) badges in QoQ % mode • Period filter: Last 3 / Last 5 / Last 7 / All reporting periods • CSV export of growth view tables (badge-free, spreadsheet-ready) • Interactive charts — select any metric, mix sections, export PNG • Five analytical tabs: Charts | Quick Analysis | Calculated Ratios | Price Analysis | Valuation • Incremental ROCE (3-year rolling) — return on newly deployed capital • Sector-aware analysis — 18 Indian sectors + 145+ GICS industries for US stocks • US stocks: Altman Z-Score, Piotroski F-Score, ROIC vs WACC, Analyst Outlook, Ownership • TradingView one-click — NSE, BSE-only, Google Finance, and US stocks • Draggable, resizable panel — Normal / Wide / Full-screen modes • Saved metric preferences — your selections persist across page visits • Auto-detects Google Finance tab changes (Annual / Quarterly / TTM) via MutationObserver • Supports Screener.in, Google Finance, stockanalysis.com, and Perplexity Finance ── SUPPORTED SITES ────────────────────────────────────────── • Screener.in — full feature set (all five tabs, all display modes) • stockanalysis.com — full feature set for both US stocks (/stocks/) and Indian stocks (/quote/nse/ and /quote/bse/) • Perplexity Finance — Charts, Quick Analysis, and Calculated Ratios • Google Finance — Charts tab with auto-refresh on tab changes ── HOW TO USE ────────────────────────────────────────── 1. Open any company page on Screener.in, stockanalysis.com, Perplexity Finance, or Google Finance 2. Click "Visualise with Finmagine" or use Ctrl+Shift+F (Cmd+Shift+F on Mac) 3. Check any metric to add it to the chart; mix sections freely — use Lines / Bars to switch chart type globally, or override per metric via the legend badge 4. In the growth view, choose Display: Values / YoY % / QoQ % / % of Sales; use the Period Filter to focus on Last 3, 5, or 7 periods; export as CSV with the Export button 5. Switch tabs to access Quick Analysis, Calculated Ratios, Price Analysis, or Valuation 6. Click TradingView in the header to open the stock's chart in TradingView Full documentation and worked examples: https://finmagine.com/chart-builder.php ── WHAT'S NEW IN v2.12.0 ────────────────────────────────────────── 🇮🇳 Indian Stocks on stockanalysis.com — Chart Builder now activates on Indian stock pages at stockanalysis.com. Previously only US stocks (/stocks/AAPL/) were supported. Indian stocks use a different URL format (/quote/nse/RELIANCE/) which is now fully detected. All five tabs — Charts, Quick Analysis, Calculated Ratios, Price Analysis, and Valuation — work on Indian stocks exactly as they do on Screener.in. ── WHAT'S NEW IN v2.11.0 ────────────────────────────────────────── 🟣 + Watch Button — A "★ + Watch" button now appears in the Chart Builder panel header on every Screener.in company page. If Finmagine Portfolio Manager is also installed, one click adds the current stock directly to your PM Watchlist without leaving the page. Confirms "✓ Watching" on success, or "✓ In WL" if the stock is already in your watchlist. 📡 Operational KPIs for AI Advisor — Chart Builder now automatically enriches AI Advisor prompts with company-specific operational KPI data when you visit a company page. Store counts, conversion rates, per-unit revenue, patent counts, debtor days, and any other company-specific operational metrics are picked up automatically and appear in the Business KPIs Deep Dive template — no extra steps required. ── WHAT'S NEW IN v2.10.0 ────────────────────────────────────────── 🎯 Trader Signals Ribbon — If you use the Finmagine Trader extension alongside Chart Builder, a new persistent ribbon now appears between the panel header and the tab bar on Screener.in company pages. It shows coloured badge chips for every active momentum scan the stock appears in — Stage 2, Near 52W High, VCP Breakout, IPO Breakout, and more. The ⭐ "All Three" badge highlights the highest-conviction signal in gold. A stale cache shows a ⚠ timestamp so you always know the age of the data. If Trader is not installed, or the stock is not in any scan, the ribbon stays hidden — no clutter. This turns Chart Builder into a unified analysis + signal surface: fundamentals and momentum on the same page, at the same time. ── WHAT'S NEW IN v2.9.0 ────────────────────────────────────────── 👤 Profile Tab — A new 7th tab on Screener.in company pages. Pulls the company's About description (with citation noise stripped), and the Screener Pros and Cons lists into a clean two-column layout — so you can read the narrative and the quick verdict without scrolling away from your analysis. 🟣 Floating Visualize Button — A compact circular button now appears on the page while the panel is closed. Hover over it and it expands to show the full "Visualize with Finmagine" label. One click opens the panel instantly — no need to find the extension icon in the toolbar. ── WHAT'S NEW IN v2.8.0 ────────────────────────────────────────── 📐 Incremental ROCE — The question ROCE doesn't answer is: what return is the company earning on NEW capital it's deploying? This new card in the Calculated Ratios tab computes ΔOperating Profit / ΔCapital Employed over a 3-year rolling window. A business with 30% ROCE but 10% Incremental ROCE is a melting ice cube. A business with 20% ROCE and 35% Incremental ROCE is a compounder. The gap between the two tells you everything about where the business is going. 🎯 Smarter Sector Detection on Google Finance & Perplexity — Quick Analysis now correctly identifies the Indian sector before running scoring. Previously, stocks on Google Finance and Perplexity defaulted to a generic profile when no sector breadcrumb was available. Now TITAN gets Jewellery benchmarks, HDFCBANK gets Banking benchmarks, regardless of which platform you're on. ── PRIVACY & PERFORMANCE ────────────────────────────────────────── • No login required — works instantly on any supported page • No personal data collected or transmitted • No trading access requested — read-only overlay • Does not modify website data — original tables always preserved • Lightweight — no background processes when the panel is closed ── ABOUT FINMAGINE ────────────────────────────────────────── Finmagine is an Indian stock market analysis platform providing professional-grade research tools, company reports, and financial education. Website: https://finmagine.com Extension guide: https://finmagine.com/chart-builder.php
5 de 54 notas
Detalhes
- Versão2.12.0
- Atualização3 de abril de 2026
- Tamanho392KiB
- IdiomasEnglish (United States)
- DesenvolvedorFinmagineWebsite
1, SBI Officers Colony, 2nd Street, Arumbakkam Chennai, Tamil Nadu 600106 INE-mail
ipersist@gmail.com - Não negocianteEsse desenvolvedor não se identificou como comerciante. Caso você seja da União Europeia, observe que os direitos do consumidor não se aplicam a contratos firmados entre você e esse desenvolvedor.
Privacidade

O desenvolvedor declara que seus dados
- Não são vendidos a terceiros, exceto nos casos de uso aprovados
- Não são usados ou transferidos para fins não relacionados à função principal do item
- Não são usados ou transferidos para informações de crédito ou empréstimo
Suporte
Para receber ajuda com perguntas, sugestões ou problemas, acesse o site de suporte do desenvolvedor.