

FAERS Safety Analytics (Now AEMS)

Overview
Explore FAERS data with interactive case-report dashboards and bulk statistical signal detection for pharmacovigilance workflows.
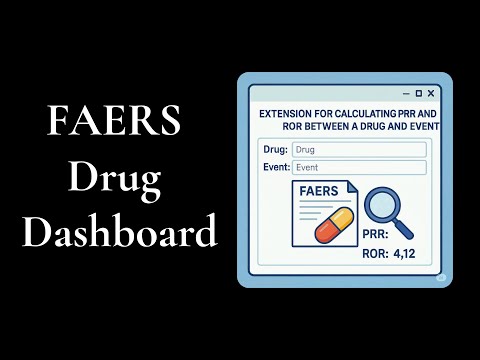
The Unified FAERS Explorer is a Chrome extension built for pharmacovigilance professionals. It interfaces directly with the FDA Adverse Event Reporting System (FAERS) via the openFDA API to automate safety signal detection and case report aggregation. The extension consolidates two primary analytical workflows into a single tool. Dashboard Analysis Users input a suspect drug and up to five specific adverse events to generate a focused case report dashboard. 1. Calculates Proportional Reporting Ratio (PRR) and Reporting Odds Ratio (ROR) with 95% confidence intervals. 2. Aggregates demographic distributions including patient sex, age group, and reporter qualification. 3. Identifies the top 10 suspect drugs and co-reported events within the queried parameter. 4. Generates a line listing of individual case safety reports exportable to CSV. 5. Supports full-page PDF export for documentation. Bulk Signal Detection Users input either a single drug or a single adverse event to execute a bulk query against the FAERS database. The tool performs approximately 500 sequential API calls to identify the most frequently associated terms. 1. Computes statistical disproportionality metrics (ROR and PRR) for the top 500 associations. 2. Filters results to display only statistically significant safety signals where the ROR lower 95% confidence interval exceeds 1.0. 3. Sorts data by case count, PRR, or ROR parameters. 4. Exports complete signal detection tables to CSV for further evaluation. Technical Specifications * Queries execute client-side directly to api.fda.gov. * Supports user-provided openFDA API keys to bypass default unauthenticated rate limits. * Implements automated rate limiting and exponential backoff to handle HTTP 429 responses during bulk signal detection. * Stores search history and API keys locally using chrome.storage.local.
0 out of 5No ratings
Details
- Version3.0.0
- UpdatedMarch 22, 2026
- Offered byDr. Vivek Poojary
- Size3.06MiB
- LanguagesEnglish
- Developer
Email
drugguardian@gmail.com - Non-traderThis developer has not identified itself as a trader. For consumers in the European Union, please note that consumer rights do not apply to contracts between you and this developer.
Privacy

This developer declares that your data is
- Not being sold to third parties, outside of the approved use cases
- Not being used or transferred for purposes that are unrelated to the item's core functionality
- Not being used or transferred to determine creditworthiness or for lending purposes