

Easy ChartFlow
1 rating
)
Overview
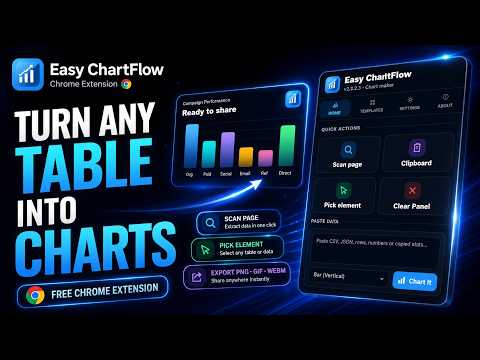
Create polished charts from webpage tables, lists and pasted data. Export images, GIFs and WebM directly in Chrome.
Easy ChartFlow helps you turn webpage data into visual visualizations directly inside Chrome. Import information from webpage tables, lists, selected text, CSV content, copied spreadsheet data, or manually entered values. Customize the appearance and export the result without switching to a separate application. Features • Import data from webpages • Convert selected text into visualizations • Paste CSV content and spreadsheet data • Create both 2D and 3D visualizations • Customize colors, labels, legends, typography, backgrounds, and layout settings • Export results as PNG, GIF, or WebM • Generate simple reports with titles, summaries, branding, and layout controls Supported Visualizations • Column and bar views • Line and area views • Pie and doughnut views • Scatter and bubble views • Radar and polar views • Heatmaps • Funnels • Timelines • Treemaps • Gauges • Financial views • Network and flow diagrams • Interactive 3D visualizations Privacy Data is processed locally in your browser. Information is only analyzed when you choose to import it from the current page. Supported Data Sources • Webpage tables • Webpage lists • Selected text • CSV content • Spreadsheet data • Manually entered values Easy ChartFlow provides a simple workflow for transforming webpage data into visual representations without leaving the current tab.
5 out of 51 rating
Details
- Version22.2.3
- UpdatedJune 4, 2026
- Offered byShahed Iqbal
- Size381KiB
- LanguagesEnglish
- Developer
Email
hq.workplaceanalyst@gmail.com - Non-traderThis developer has not identified itself as a trader. For consumers in the European Union, please note that consumer rights do not apply to contracts between you and this developer.
Privacy

Easy ChartFlow has disclosed the following information regarding the collection and usage of your data. More detailed information can be found in the developer's privacy policy.
Easy ChartFlow handles the following:
This developer declares that your data is
- Not being sold to third parties, outside of the approved use cases
- Not being used or transferred for purposes that are unrelated to the item's core functionality
- Not being used or transferred to determine creditworthiness or for lending purposes
Support
For help with questions, suggestions, or problems, please open this page on your desktop browser