

Datastripes Lens - Web Tables and Data to Dashboard

Overview
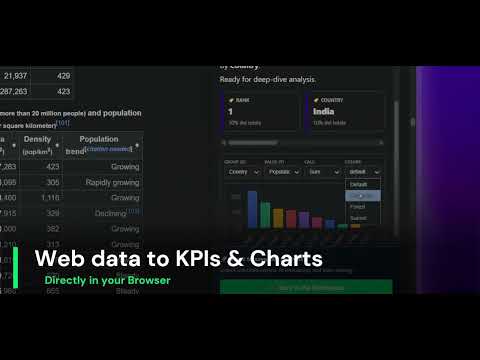
Instantly turn any HTML webpage table into interactive charts. Stop copy-pasting data into Excel, visualize it in one click.
🏆 Top 5 Product of the Day on Product Hunt Stop copy-pasting web tables into Excel or Google Sheets just to create a simple graph. Datastripes Lens instantly transforms static data tables on any webpage into a gallery of interactive charts and actionable insights—without ever leaving the page. Whether you are analyzing financial reports, competitor pricing pages, web analytics, or crypto trends, Datastripes Lens acts as a powerful data visualizer built right into your browser. Instant HTML Table to Chart Conversion Click on any data table to generate a full suite of visualizations. Includes Bar, Line, Pie, Doughnut, Polar, and Radar charts to give you the perfect perspective on your data. Smart Auto-Configuration Lens intelligently analyzes columns to automatically suggest the best dimensions (categories, dates) and metrics (numbers, currency) for instant, meaningful charts. No manual setup needed. Pivot Table & Data Aggregation Go beyond simple charts. Group your data by any column and perform instant calculations like Sum, Count, Average, Min, and Max. It’s like a pivot table, but faster and more intuitive. Outliers & Insights Widget Instantly identify the highest (🏆 Top) and lowest (📉 Lowest) values in your data to spot trends, anomalies, and critical insights at a glance. Professional Image Exports Customize your charts with professional color palettes and export them as high-quality PNG images, ready to be pasted into your pitch decks, reports, and presentations. LOCAL PROCESSING Your data never leaves your computer. Datastripes Lens processes all data and calculations entirely within your browser local session. We do not store, collect, or transmit your sensitive financial, business, or personal tables to any external servers. Perfect for enterprise and corporate use. PERFECT FOR: • Financial Analysts studying market data (Yahoo Finance, SEC filings). • Growth Marketers and SEOs analyzing web traffic and competitor metrics. • Product Managers reviewing pricing pages and feature tables. • Researchers and Students working with academic data tables. Turn your browser into a powerful Business Intelligence tool. Install Datastripes Lens today and start visualizing web data instantly.
5 out of 51 rating
Details
- Version0.4.1
- UpdatedJuly 1, 2026
- Size144KiB
- LanguagesEnglish
- DeveloperWebsite
Email
info@superiorgames.eu - Non-traderThis developer has not identified itself as a trader. For consumers in the European Union, please note that consumer rights do not apply to contracts between you and this developer.
Privacy

Datastripes Lens - Web Tables and Data to Dashboard has disclosed the following information regarding the collection and usage of your data. More detailed information can be found in the developer's privacy policy.
Datastripes Lens - Web Tables and Data to Dashboard handles the following:
This developer declares that your data is
- Not being sold to third parties, outside of the approved use cases
- Not being used or transferred for purposes that are unrelated to the item's core functionality
- Not being used or transferred to determine creditworthiness or for lending purposes
Support
For help with questions, suggestions, or problems, visit the developer's support site