


Overview
This tool allows you to draw circles of any size on Google Maps.
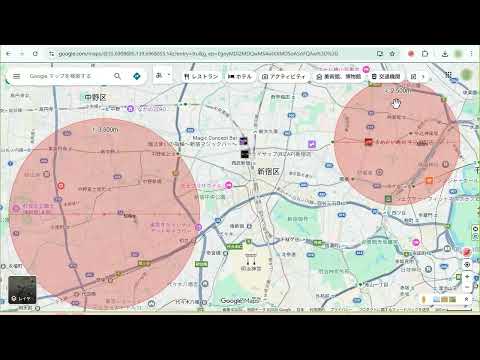
Right-click anywhere on the map to specify a location, then intuitively display a circle with your chosen radius (e.g., 500m, 2km). By visualizing distances, it's ideal for understanding geographic boundaries—perfect for trade area analysis, area survey strategies, and more. Due to specification changes in Google Maps, circles may occasionally fail to render. In such cases, we are already working on a fix and waiting for review. Thank you for your patience. Key Features ✔ Easy Drawing: Right-click anywhere on the map and select "Draw Circle" to create a circle instantly. ✔ Multiple Circles: Draw multiple circles to compare different areas with ease. ✔ Precise & Persistent: Circles maintain their scale when zooming. Drag to fine-tune positions. Your circles are saved automatically and persist even after reloading the page. ✔ Flexible Units: Switch between kilometers (km) and meters (m) at any time. Adjust circle size in 100m increments directly on the map. ✔ Undo/Redo History: Includes a history button (↺) to revert changes to circle size or position. ✔ Cloud Sync: Your circle data now syncs across any Chrome browser where you are logged into the same Google account. ✔ Quick Toggle: Enable or disable drawing mode via the icon in the bottom-right corner. ✔ When you select text on a web page, the option “Search for ‘selected text’ on Google Maps” will be added to the right-click menu. Install Circle for Google Maps today and start visualizing distances on your map! Use Cases Service & Sales Area Visualization Clearly define service boundaries for delivery, business trips, or door-to-door sales. Example: Visualize a "Free Delivery Zone" within 5km of your shop. Site & Trade Area Analysis Analyze locations relative to competitors and customer distribution for new store openings. Example: Evaluate commuter inflow by marking walking distances (1km, 2km) from major stations. Event & Marketing Planning Define target areas for promotions based on the expected travel range of attendees. Example: Distribute flyers within a 3km radius of a fireworks festival venue. Real Estate & Location Marketing Visually present "walking distance from station" or proximity to local amenities. Example: Show that supermarkets, schools, and hospitals are within 800m of a property. Education & Research Geographically categorize school districts or survey areas. Example: Create materials showing the impact radius of observation points for biological surveys or regional studies. Disaster Prevention & Safety Planning Visualize impact zones from hazardous facilities (chemical plants, rivers, fault lines). Example: Plan supplies by estimating the population within 500m of a designated evacuation center. ==== Latest Update 0.1.9 ==== New Features: Added dynamic initial circle sizing based on your current zoom level when creating a new circle. Fixes & Updates: Improved circle tracking when moving the map. Fixed a bug where circles multiplied when opening the popup. Pins are no longer dropped on the map when closing the popup. Scale labels are now hidden if they overlap or exceed the circle boundary. Fixed a bug where circles appeared in incorrect positions when rotating the map. Added bounding boxes for selected circles. Enabled data synchronization across Chrome browsers. Map orientation (bearing) and tilt are now reset when drawing a circle via the right-click menu for better accuracy.
0 out of 5No ratings
Details
- Version0.1.14
- UpdatedJune 15, 2026
- Size55.92KiB
- Languages2 languages
- DeveloperWebsite
Email
info2@comcent.co.jp - Non-traderThis developer has not identified itself as a trader. For consumers in the European Union, please note that consumer rights do not apply to contracts between you and this developer.
Privacy

This developer declares that your data is
- Not being sold to third parties, outside of the approved use cases
- Not being used or transferred for purposes that are unrelated to the item's core functionality
- Not being used or transferred to determine creditworthiness or for lending purposes
Support
For help with questions, suggestions, or problems, visit the developer's support site