

ChromeDebug MCP Assistant FREE

Overview
AI-powered browser debugging with visual element selection and screen recording for developers
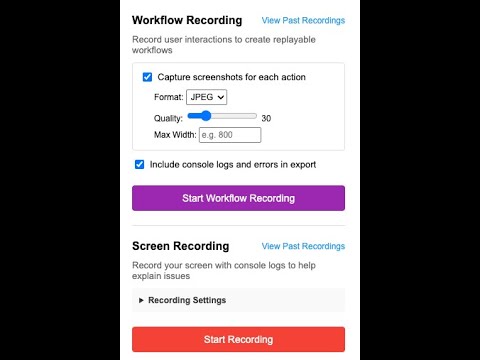
🎯 ChromeDebug MCP - AI Browser Control Made Simple Give your AI assistant eyes into your browser. ChromeDebug connects AI assistants like Claude Code directly to Chrome, letting AI see, interact with, and debug web pages alongside you. ━━━━━━━━━━━━━━━━━━━━━━━━━━━━━━━━━━━━━━━━━ ⚡ WHAT IT DOES • Click any element → AI can modify it • Record your screen → AI sees what went wrong • Capture workflows → AI replays your steps • View console logs → AI debugs errors with you ━━━━━━━━━━━━━━━━━━━━━━━━━━━━━━━━━━━━━━━━━ 🎬 FOUR RECORDING MODES 📹 Screen Recording Capture video of your browser with synchronized console logs. Perfect for bug reports. 📋 Workflow Recording Record clicks, inputs, and page states. AI can replay and debug your exact steps. 📸 Screenshot Recording (NEW) Click-to-capture with countdown timer. Grab dropdown menus, modals, and dynamic content. 🎥 VIDEO Recording • Built-in video player with speed control • Export recordings as MP4 or ZIP • Console logs sync with playback • Create bug reports & tutorials in seconds ━━━━━━━━━━━━━━━━━━━━━━━━━━━━━━━━━━━━━━━━━ 🔒 PRIVACY FIRST ✓ 100% local - recordings stay on YOUR machine ✓ No cloud uploads ✓ No account required ✓ No tracking or analytics ━━━━━━━━━━━━━━━━━━━━━━━━━━━━━━━━━━━━━━━━━ 🆓 FREE VERSION INCLUDES • 5 recordings per day • All recording modes • Visual element selection • Full MCP integration • Frame viewer with console logs ━━━━━━━━━━━━━━━━━━━━━━━━━━━━━━━━━━━━━━━━━ 💎 UPGRADE TO PRO • Unlimited recordings • Export as ZIP or MP4 video • Function call tracing • Priority support Get PRO: https://chromedebug.com/checkout/buy/996773cb-682b-430f-b9e3-9ce2130bd967 ━━━━━━━━━━━━━━━━━━━━━━━━━━━━━━━━━━━━━━━━━ 📚 GETTING STARTED 1. Install extension 2. Install MCP server: npm install -g @dynamicu/chromedebug-mcp 3. Add to Claude Code: claude mcp add chromedebug -- chromedebug-mcp 4. Start debugging! Documentation: https://www.npmjs.com/package/@dynamicu/chromedebug-mcp Support: https://github.com/dynamicupgrade/ChromeDebug/issues ━━━━━━━━━━━━━━━━━━━━━━━━━━━━━━━━━━━━━━━━━ 💡 EXAMPLE USE CASES "Show Claude what's broken" → Record the bug, share with AI, get a fix "Let AI modify the page" → Click element, ask Claude to style it "Debug that weird error" → AI sees your console logs in real-time "Document a workflow" → Capture step-by-step screenshots automatically ━━━━━━━━━━━━━━━━━━━━━━━━━━━━━━━━━━━━━━━━━ Works with Claude Code CLI and any MCP-compatible AI assistant. Questions? https://github.com/dynamicupgrade/ChromeDebug/discussions
0 out of 5No ratings
Details
- Version2.7.3
- UpdatedDecember 23, 2025
- Offered bydynamicupgrade
- Size197KiB
- LanguagesEnglish
- DeveloperDynamic Upgrade LLC
2840 E Germann Rd Chandler, AZ 85286-1400 USEmail
dynamicupgrade@gmail.comPhone
+1 702-530-9833 - TraderThis developer has identified itself as a trader per the definition from the European Union and committed to only offer products or services that comply with EU laws.
- D-U-N-S119471095
Privacy

This developer declares that your data is
- Not being sold to third parties, outside of the approved use cases
- Not being used or transferred for purposes that are unrelated to the item's core functionality
- Not being used or transferred to determine creditworthiness or for lending purposes