


Overview
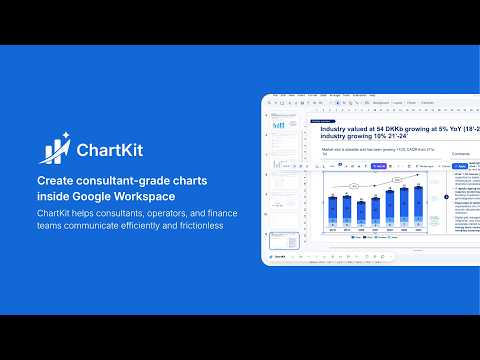
Create and edit professional stacked bar, waterfall, line, and scatter charts directly inside Google Slides, Docs, and Sheets.
ChartKit lets you create and edit professional charts directly inside Google Slides, Google Docs, and Google Sheets. Features: - Editable data grids for entering chart data - Charts editable directly inside Google Slides - Segment and total labels - Delta arrows (absolute, percentage, or both) - Compound annual growth rate guides - Customizable color themes - Chart memory for quick re-editing - Right-click context menu for chart actions ChartKit requires a free or paid account. A free trial of 14 days is available.
5 out of 59 ratings
Details
- Version1.1.8
- UpdatedJuly 5, 2026
- FeaturesOffers in-app purchases
- Size2.37MiB
- LanguagesEnglish
- DeveloperWebsite
Email
contact@getchartkit.app - Non-traderThis developer has not identified itself as a trader. For consumers in the European Union, please note that consumer rights do not apply to contracts between you and this developer.
Privacy

ChartKit has disclosed the following information regarding the collection and usage of your data. More detailed information can be found in the developer's privacy policy.
ChartKit handles the following:
This developer declares that your data is
- Not being sold to third parties, outside of the approved use cases
- Not being used or transferred for purposes that are unrelated to the item's core functionality
- Not being used or transferred to determine creditworthiness or for lending purposes