

ChartGrabber — Extract data from any chart

Overview
Click any chart and get the numbers behind it as CSV or Excel. Reads chart libraries, network JSON, SVG — and image charts.
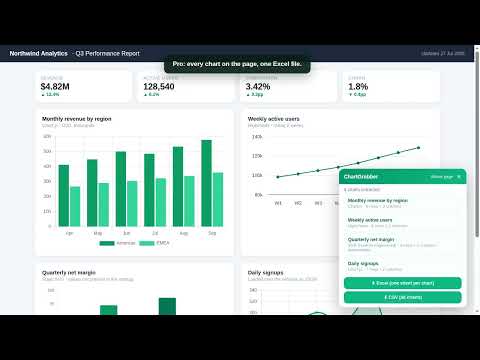
WHY DOES IT ASK FOR ACCESS TO ALL SITES? A chart can be on any page, so Chrome shows one warning that covers every site. In practice ChartGrabber reads a chart only after you click its toolbar icon and pick that chart yourself. Nothing is uploaded — not the page content, not the URL, not the extracted data. There is no analytics SDK and no tracking of any kind. The only request the extension ever makes on its own is a license check to Gumroad, and only if you have entered a license key. ━━━━━━━━━━━━━━━━━━━━ Charts are everywhere — quarterly reports, dashboards, news articles, research papers. The numbers are right there on your screen, and yet there is no way to get them out. Developers open the network tab and dig through JSON. Everyone else squints at the screen and retypes values by hand. ChartGrabber does it in one click. Press the extension, click the chart you want, and a preview table appears with the values behind it. Copy it straight into Excel or Google Sheets, or download it as a CSV file. ━━━━━━━━━━━━━━━━━━━━ FOUR WAYS TO GET THE DATA ChartGrabber tries every route a chart's data can take, automatically — and when a chart is just a picture, you can digitize it by hand: 1. Network JSON capture — grabs the raw JSON the page fetched to draw its graph. This is the original source data, exact to the last decimal. 2. Chart library reader — reads series directly out of Highcharts, Chart.js, ECharts and Plotly instances running on the page. 3. SVG reverse-engineering — for plain SVG charts (D3, Recharts and similar), it reads the axis tick labels and converts pixel positions back into values. Approximate results are clearly labelled as such. 4. Image digitizer — for a chart that is only a picture (a PNG in a report, a canvas chart, a screenshot), mark the two axes, click the data points, and ChartGrabber converts pixel positions into a table. All three work inside embedded iframes too, so charts dropped into an article by Datawrapper or Flourish are extractable like any other. ━━━━━━━━━━━━━━━━━━━━ WHAT YOU GET • Preview table before you export — see exactly what was found • Copy as TSV — pastes into Excel and Google Sheets in neat columns • CSV download • Real .xlsx export (Pro) — a genuine Excel workbook, numbers stored as numbers • Whole-page batch (Pro) — every chart on the page, one sheet each, in a single workbook • Works inside embedded iframes — Datawrapper, Flourish and similar embeds included • Multi-series charts merged into one table • Network JSON capture (Pro) • Image digitizer for charts that are only pictures • Reads Highcharts, Chart.js, ECharts, Plotly, ApexCharts, FusionCharts, Google Charts, amCharts and HTML tables • 16 languages, switches automatically with your browser ━━━━━━━━━━━━━━━━━━━━ PRIVACY Extraction runs entirely inside your browser, on the page you explicitly chose. No page content, no URLs, and none of the extracted data is ever sent anywhere. There is no analytics SDK and no tracking of any kind. The only request the extension makes on its own is a license check against Gumroad, and only if you have entered a license key. ━━━━━━━━━━━━━━━━━━━━ PRICING Free — 10 extractions per month, all three engines, CSV and clipboard export. Pro — $4.99/month or $39/year: unlimited extractions, real .xlsx export, whole-page batch extraction, network JSON capture, multi-series tables. Lifetime — $79 once, everything in Pro forever. Payments are handled securely by Gumroad. Paste the license key from your email into the extension and Pro unlocks instantly. Full refund within 14 days if it doesn't work for you. ━━━━━━━━━━━━━━━━━━━━ LIMITATIONS, HONESTLY Charts drawn as a flat image (PNG/JPG), or on a bare canvas with no chart library present, cannot be read automatically — for those, the image digitizer lets you mark the axes and click the points, which gives an approximate but usually very close result. Where an SVG chart has readable axis labels, ChartGrabber reconstructs values from pixel geometry and marks the result as approximate. Everything else — network JSON and chart library data — is exact.
0 out of 5No ratings
Details
- Version1.0.0
- UpdatedAugust 14, 2026
- FeaturesOffers in-app purchases
- Offered bypuretaste83
- Size91.09KiB
- Languages16 languages
- Developer이명훈
감일순환로135 503-904 하남시, 경기도 12996 KREmail
puretaste83@gmail.comPhone
+82 10-4182-8958 - TraderThis developer has identified itself as a trader per the definition from the European Union and committed to only offer products or services that comply with EU laws.
Privacy

This developer declares that your data is
- Not being sold to third parties, outside of the approved use cases
- Not being used or transferred for purposes that are unrelated to the item's core functionality
- Not being used or transferred to determine creditworthiness or for lending purposes
Support
For help with questions, suggestions, or problems, visit the developer's support site