


Overview
On-device classification and regression in Google Sheets.
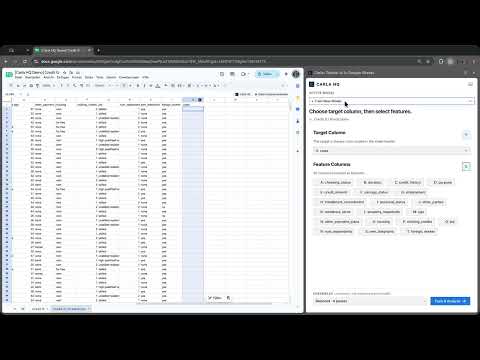
Run tabular machine learning directly in Google Sheets. Carla runs tabular foundation models locally in your browser. Select your columns, train a model on your data, inspect evaluation metrics, and generate predictions or synthetic data in seconds. No cloud APIs, no external servers, and no data leaves your machine. 📊 Why run models in your spreadsheet? Tabular ML workflows typically require moving data out of spreadsheets: exporting CSVs, writing Python scripts, training models on external servers, and pasting results back. Carla runs the entire workflow inside your spreadsheet side panel using your local machine. Your data stays in your browser tab. ⚡ Zero preprocessing with TabICLv2 Carla uses the TabICLv2 tabular foundation model. It handles categorical values, missing cells, dates, and numerical columns automatically. You do not need to write encoding pipelines, scale numerical features, or tune hyperparameters. 🧪 Train and test split evaluation Carla automatically splits your data into training and test sets to validate model quality before you run predictions: • Classification metrics: Accuracy, ROC-AUC, F1-Score, Precision, Recall, and confusion matrices. • Regression metrics: Root Mean Squared Error (RMSE), Mean Absolute Error (MAE), and R² coefficient of determination. 🎲 Synthetic data generation Generate synthetic rows directly from your existing columns. Carla models the distributions and relationships in your table, creating realistic sample data for testing, development, and scenario modeling without exposing real records. 🔍 Local explainability (SHAP) Every prediction includes on-device feature attribution. Carla generates local SHAP waterfall charts in the sidebar, showing exactly which column values pushed a prediction up or down. 🔒 100% private by default Carla has no backend servers. All model computation, metric evaluation, and synthetic data generation happen in memory on your machine. Your proprietary customer tables, financial records, and operational figures remain strictly local. ✨ Key capabilities: • Tabular foundation model: Powered by TabICLv2 for instant classification and regression without manual preprocessing. • Test split evaluation: Computes Accuracy, ROC-AUC, F1, Precision, Recall, RMSE, MAE, and R² out-of-sample. • Synthetic data generation: Creates realistic sample rows matching your column distributions. • Local SHAP charts: Explains individual predictions with visual feature attribution. • Zero external dependencies: Runs locally without cloud subscriptions, API keys, or remote data transfer. 🚀 How to get started: 1. Open any sheet in Google Sheets and open the Carla sidebar. 2. Select your target column and your feature columns. 3. Click "Train" to evaluate test split metrics and inspect SHAP explainability. 4. Run predictions on new rows or generate synthetic data directly in your sheet.
0 out of 5No ratings
Details
- Version1.1.1
- UpdatedSeptember 10, 2026
- Size148MiB
- LanguagesEnglish
- DeveloperWebsite
Email
dani.munch@gmail.com - Non-traderThis developer has not identified itself as a trader. For consumers in the European Union, please note that consumer rights do not apply to contracts between you and this developer.
Privacy

This developer declares that your data is
- Not being sold to third parties, outside of the approved use cases
- Not being used or transferred for purposes that are unrelated to the item's core functionality
- Not being used or transferred to determine creditworthiness or for lending purposes