

API Monitor
2 ratings
)
Overview
Monitor web API requests without opening DevTools.
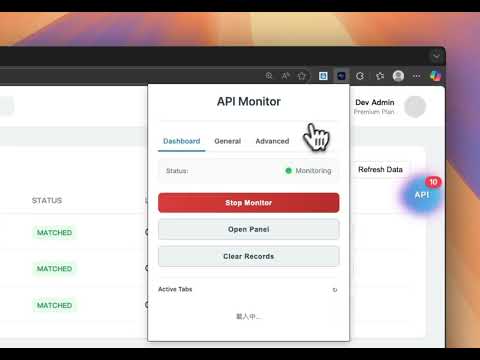
🚀 API Monitor v1.2.2 – Advanced On-Page API Inspector & Console Monitor No need to open Chrome DevTools. API Monitor captures XHR and Fetch requests through a floating on-page panel — inspect details, replay requests, monitor console logs, and manage storage without leaving the page. ✨ What's New in v1.2.2 ✅ Request Replay — edit and resend any captured request; diff view compares replayed vs original; localhost mode with remembered port ✅ Improved JSON Viewer — auto-expands nested structures; smoother interactions ✅ API Detail Tab Mode — tabbed layout (Response / Request / General / Headers) with drag-to-reorder in settings ✅ Redesigned Storage Panel — hover-reveal Edit/Delete, inline editing, add new entries; supports LocalStorage, SessionStorage, and Cookies 🔧 Previous Highlights v1.2.0 — HAR file export (Postman-compatible), dedicated "Copy cURL" button per record v1.1.2 — Real-time console log monitoring with level filtering, keyword search, and stack trace 🎯 Core Features 🔍 Network — captures XHR & Fetch; filter by URL, method, status, latency, time range; domain allow/block list 🧐 Inspect — headers, body (JSON/text/FormData), response time; one-click cURL copy and HAR export 📊 Console — real-time log capture with level filter (log/warn/error/info/debug) and keyword search 💾 Application — inspect and manage LocalStorage, SessionStorage, and Cookies 🔐 Permissions — browser permission status at a glance (camera, mic, geolocation, etc.) 🔒 Privacy — all data stays local; nothing sent to external servers 🌐 Chrome/Chromium 90+ · Edge 90+ · Manifest V3
5 out of 52 ratings
Details
- Version1.2.2
- UpdatedMay 2, 2026
- Offered byrock98055
- Size110KiB
- Languages3 languages
- Developer
Email
rock98055@gmail.com - Non-traderThis developer has not identified itself as a trader. For consumers in the European Union, please note that consumer rights do not apply to contracts between you and this developer.
Privacy

This developer declares that your data is
- Not being sold to third parties, outside of the approved use cases
- Not being used or transferred for purposes that are unrelated to the item's core functionality
- Not being used or transferred to determine creditworthiness or for lending purposes