

AI Chart Intelligence Tool
4 lượt xếp hạng
)
Tổng quan
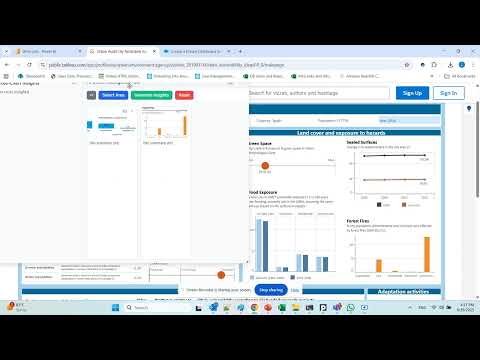
Capture chart snippets and get AI insights
AI Chart Intelligence Tool: Capture charts from multiple web sources, explore insights, and boost your data understanding with AI. Overview: AI Chart Intelligence Tool helps you make sense of charts and dashboards instantly. With just a few clicks, you can capture any chart from your browser, and our AI will generate clear explanations, insights, and trends — all without leaving your workflow. Features: 📸 Chart Snippet Capture – Select and capture charts, graphs, or visualizations directly from your browser. 🤖 AI-Powered Insights – Instantly get plain-language explanations and key takeaways from captured charts. 🗂 Gallery Mode – Save multiple captured charts and insights for side-by-side comparison. 📝 Cross-Chart Summaries – Combine multiple visualizations into a single summary to understand the bigger picture. 📋 Copy Insights – Easily copy generated insights for quick sharing or documentation. (Coming soon: one-click export to PowerPoint for seamless presentations!) 🔊 Text-to-Speech (TTS) – Listen to insights read aloud for hands-free analysis. 🎛 Flexible UI – Move, resize, and customize the extension panel while working with dashboards. Works With: AI Chart Intelligence Tool is designed to work with all major BI and visualization web platforms, including: - Microsoft Power BI - Tableau - Looker - Qlik - Any other web site with chart visualizations And most web-based reporting or dashboarding tools Why Use It? Whether you’re an analyst, business user, or decision-maker, this extension helps you: - Understand data faster - Reduce time spent interpreting dashboards - Share AI-generated summaries with colleagues - Get insights anywhere, anytime, from your browser Privacy & Security - Your browsing history is not tracked. - Captured charts are only processed to generate insights. - Data is stored locally in your browser unless you choose to reset it. - For more details, see our Privacy Policy. Get Started - Install the extension. - Open any dashboard or chart in your browser. - Click the extension icon → Select a chart area → Get instant AI insights.
5/54 lượt xếp hạng
Chi tiết
- Phiên bản2.8
- Đã cập nhật18 tháng 10, 2025
- Nhà cung cấpgreenwaldliron
- Kích thước22.35KiB
- Ngôn ngữEnglish (United States)
- Nhà phát triển
Email
greenwaldliron1@gmail.com - Người bán phi thương mạiNhà phát triển này không tự nhận mình là người bán. Đối với người tiêu dùng ở Liên minh Châu Âu, xin lưu ý rằng các quyền của người tiêu dùng không được áp dụng trong hợp đồng giữa bạn và nhà phát triển này.
Quyền riêng tư
Nhà phát triển này tuyên bố rằng dữ liệu của bạn
- Không được bán cho bên thứ ba, ngoài những trường hợp sử dụng đã được phê duyệt
- Không được sử dụng hoặc chuyển nhượng cho các mục đích không liên quan đến chức năng chính của mặt hàng
- Không được sử dụng hoặc chuyển nhượng để xác định khả năng thanh toán nợ hoặc phục vụ mục đích cho vay