

AI Chart Intelligence Tool
4 notas
)
Visão geral
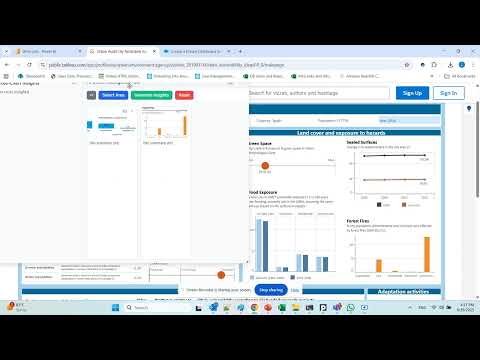
Capture chart snippets and get AI insights
AI Chart Intelligence Tool: Capture charts from multiple web sources, explore insights, and boost your data understanding with AI. Overview: AI Chart Intelligence Tool helps you make sense of charts and dashboards instantly. With just a few clicks, you can capture any chart from your browser, and our AI will generate clear explanations, insights, and trends — all without leaving your workflow. Features: 📸 Chart Snippet Capture – Select and capture charts, graphs, or visualizations directly from your browser. 🤖 AI-Powered Insights – Instantly get plain-language explanations and key takeaways from captured charts. 🗂 Gallery Mode – Save multiple captured charts and insights for side-by-side comparison. 📝 Cross-Chart Summaries – Combine multiple visualizations into a single summary to understand the bigger picture. 📋 Copy Insights – Easily copy generated insights for quick sharing or documentation. (Coming soon: one-click export to PowerPoint for seamless presentations!) 🔊 Text-to-Speech (TTS) – Listen to insights read aloud for hands-free analysis. 🎛 Flexible UI – Move, resize, and customize the extension panel while working with dashboards. Works With: AI Chart Intelligence Tool is designed to work with all major BI and visualization web platforms, including: - Microsoft Power BI - Tableau - Looker - Qlik - Any other web site with chart visualizations And most web-based reporting or dashboarding tools Why Use It? Whether you’re an analyst, business user, or decision-maker, this extension helps you: - Understand data faster - Reduce time spent interpreting dashboards - Share AI-generated summaries with colleagues - Get insights anywhere, anytime, from your browser Privacy & Security - Your browsing history is not tracked. - Captured charts are only processed to generate insights. - Data is stored locally in your browser unless you choose to reset it. - For more details, see our Privacy Policy. Get Started - Install the extension. - Open any dashboard or chart in your browser. - Click the extension icon → Select a chart area → Get instant AI insights.
5 de 54 notas
Detalhes
- Versão2.8
- Atualização18 de outubro de 2025
- Oferecido porgreenwaldliron
- Tamanho22.35KiB
- IdiomasEnglish (United States)
- Desenvolvedor
E-mail
greenwaldliron1@gmail.com - Não negocianteEsse desenvolvedor não se identificou como comerciante. Caso você seja da União Europeia, observe que os direitos do consumidor não se aplicam a contratos firmados entre você e esse desenvolvedor.
Privacidade
O desenvolvedor declara que seus dados
- Não são vendidos a terceiros, exceto nos casos de uso aprovados
- Não são usados ou transferidos para fins não relacionados à função principal do item
- Não são usados ou transferidos para informações de crédito ou empréstimo